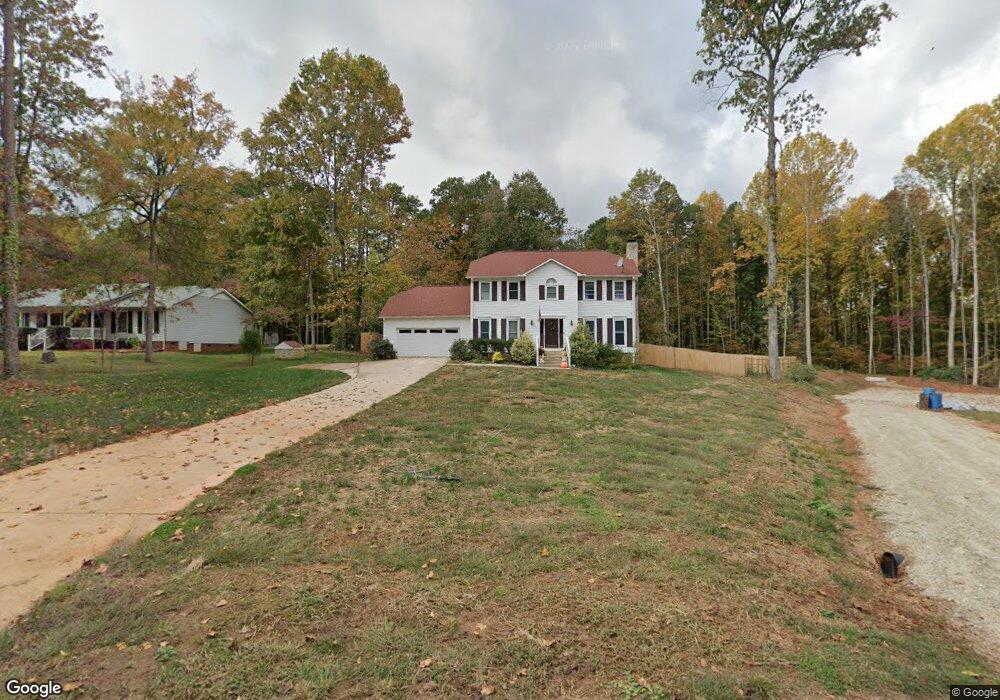
210 Timberlake Dr Unit 30 Salisbury, NC 28147
Estimated Value: $371,000 - $441,000
4
Beds
3
Baths
2,400
Sq Ft
$165/Sq Ft
Est. Value
About This Home
This home is located at 210 Timberlake Dr Unit 30, Salisbury, NC 28147 and is currently estimated at $395,688, approximately $164 per square foot. 210 Timberlake Dr Unit 30 is a home located in Rowan County with nearby schools including Hurley Elementary School, Knox Middle School, and North Rowan Middle School.
Ownership History
Date
Name
Owned For
Owner Type
Purchase Details
Closed on
Jul 30, 2020
Sold by
Florian Keith and Koller Mary Jane
Bought by
Hiller Marcus B
Current Estimated Value
Home Financials for this Owner
Home Financials are based on the most recent Mortgage that was taken out on this home.
Original Mortgage
$210,732
Outstanding Balance
$187,279
Interest Rate
3.1%
Mortgage Type
VA
Estimated Equity
$208,409
Purchase Details
Closed on
Sep 22, 2016
Sold by
Lance Cecil Kenneth and Lance Kim Clayton
Bought by
Florian Keith and Koller Mary Jane
Home Financials for this Owner
Home Financials are based on the most recent Mortgage that was taken out on this home.
Original Mortgage
$215,916
Interest Rate
3.37%
Mortgage Type
FHA
Purchase Details
Closed on
Apr 30, 2002
Bought by
Lance Cecil Kenneth and Lance Wf
Create a Home Valuation Report for This Property
The Home Valuation Report is an in-depth analysis detailing your home's value as well as a comparison with similar homes in the area
Home Values in the Area
Average Home Value in this Area
Purchase History
| Date | Buyer | Sale Price | Title Company |
|---|---|---|---|
| Hiller Marcus B | $200,000 | None Available | |
| Florian Keith | $220,000 | None Available | |
| Lance Cecil Kenneth | $168,000 | -- |
Source: Public Records
Mortgage History
| Date | Status | Borrower | Loan Amount |
|---|---|---|---|
| Open | Hiller Marcus B | $210,732 | |
| Previous Owner | Florian Keith | $215,916 |
Source: Public Records
Tax History Compared to Growth
Tax History
| Year | Tax Paid | Tax Assessment Tax Assessment Total Assessment is a certain percentage of the fair market value that is determined by local assessors to be the total taxable value of land and additions on the property. | Land | Improvement |
|---|---|---|---|---|
| 2025 | $1,964 | $289,943 | $32,000 | $257,943 |
| 2024 | $1,927 | $284,414 | $32,000 | $252,414 |
| 2023 | $1,927 | $284,414 | $32,000 | $252,414 |
| 2022 | $1,431 | $189,586 | $24,000 | $165,586 |
| 2021 | $1,417 | $189,586 | $24,000 | $165,586 |
| 2020 | $1,417 | $189,586 | $24,000 | $165,586 |
| 2019 | $1,417 | $189,586 | $24,000 | $165,586 |
| 2018 | $1,215 | $163,955 | $24,000 | $139,955 |
| 2017 | $1,215 | $163,955 | $24,000 | $139,955 |
| 2016 | $1,215 | $163,955 | $24,000 | $139,955 |
| 2015 | $1,230 | $163,955 | $24,000 | $139,955 |
| 2014 | $1,159 | $162,089 | $24,000 | $138,089 |
Source: Public Records
Map
Nearby Homes
- 715 Candlewick Dr
- 223 Wendover Dr
- 1612 Mooresville Rd
- 151 Falling Up Ln
- 145 Falling Up Ln
- 121 Falling Up Ln
- 133 Falling Up Ln
- 136 Early Bird Ln
- 130 Early Bird Ln
- 157 Falling Up Ln
- 142 Early Bird Ln
- 150 Early Bird Ln
- 163 Falling Up Ln
- 127 Falling Up Ln
- 146 Falling Up Ln
- 152 Falling Up Ln
- Robie Plan at Silverstein
- Hayden Plan at Silverstein
- 210 Timberlake Dr
- 208 Timberlake Dr
- 212 Timberlake Dr
- 104 Belle Ct
- 275 Timberlake Dr
- 211 Timberlake Dr
- 103 Belle Ct
- 204 Timberlake Dr
- 209 Timberlake Dr
- 106 Belle Ct
- 205 Timberlake Dr
- 107 Belle Ct
- 0 Timberlake Dr
- 706 Candlewick Dr
- 606 Candlewick Dr
- 702 Candlewick Dr
- 604 Candlewick Dr
- 602 Candlewick Dr
- 710 Candlewick Dr
- 705 Candlewick Dr