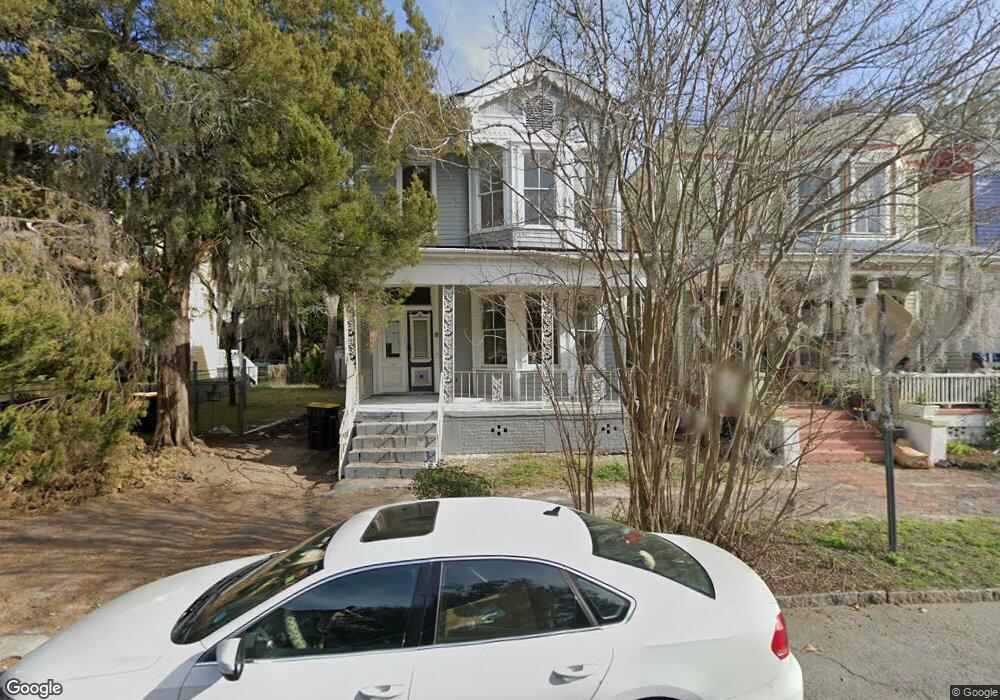
210 W 39th St Savannah, GA 31401
Metropolitan NeighborhoodEstimated Value: $543,000 - $600,000
4
Beds
3
Baths
1,776
Sq Ft
$323/Sq Ft
Est. Value
About This Home
This home is located at 210 W 39th St, Savannah, GA 31401 and is currently estimated at $573,822, approximately $323 per square foot. 210 W 39th St is a home located in Chatham County with nearby schools including Hodge Elementary School, Derenne Middle School, and Beach High School.
Ownership History
Date
Name
Owned For
Owner Type
Purchase Details
Closed on
Mar 8, 2021
Sold by
Williams Troy P
Bought by
Lehman Blair A
Current Estimated Value
Home Financials for this Owner
Home Financials are based on the most recent Mortgage that was taken out on this home.
Original Mortgage
$273,990
Outstanding Balance
$245,613
Interest Rate
2.7%
Mortgage Type
New Conventional
Estimated Equity
$328,209
Purchase Details
Closed on
Dec 12, 2005
Sold by
Not Provided
Bought by
Williams Troy P
Home Financials for this Owner
Home Financials are based on the most recent Mortgage that was taken out on this home.
Original Mortgage
$126,000
Interest Rate
6.29%
Mortgage Type
New Conventional
Create a Home Valuation Report for This Property
The Home Valuation Report is an in-depth analysis detailing your home's value as well as a comparison with similar homes in the area
Home Values in the Area
Average Home Value in this Area
Purchase History
| Date | Buyer | Sale Price | Title Company |
|---|---|---|---|
| Lehman Blair A | $343,990 | -- | |
| Williams Troy P | $160,000 | -- |
Source: Public Records
Mortgage History
| Date | Status | Borrower | Loan Amount |
|---|---|---|---|
| Open | Lehman Blair A | $273,990 | |
| Previous Owner | Williams Troy P | $126,000 |
Source: Public Records
Tax History Compared to Growth
Tax History
| Year | Tax Paid | Tax Assessment Tax Assessment Total Assessment is a certain percentage of the fair market value that is determined by local assessors to be the total taxable value of land and additions on the property. | Land | Improvement |
|---|---|---|---|---|
| 2025 | $2,828 | $199,760 | $50,000 | $149,760 |
| 2024 | $2,828 | $201,280 | $50,000 | $151,280 |
| 2023 | $1,026 | $193,720 | $50,000 | $143,720 |
| 2022 | $1,171 | $137,560 | $28,720 | $108,840 |
| 2021 | $4,270 | $95,960 | $26,000 | $69,960 |
| 2020 | $2,779 | $88,000 | $26,000 | $62,000 |
| 2019 | $3,910 | $88,000 | $26,000 | $62,000 |
| 2018 | $3,274 | $87,000 | $26,000 | $61,000 |
| 2017 | $3,043 | $72,800 | $10,160 | $62,640 |
| 2016 | $2,134 | $73,160 | $10,160 | $63,000 |
| 2015 | $3,098 | $74,280 | $10,160 | $64,120 |
| 2014 | $3,609 | $69,040 | $0 | $0 |
Source: Public Records
Map
Nearby Homes
- 221 W 39th St
- 303 W 39th St
- 2309 Jefferson St
- 302 W 38th St
- 306 W 38th St
- 312 W 38th St
- 217 W 36th St
- 2406 De Soto Ave Unit B
- 310 W 42nd St
- 510 W 39th St
- 420 W 42nd St
- 518 W 38th St
- 526 W 39th St Unit 528
- 526 W 39th St
- 17 E 37th St Unit 11
- 17 E 37th St Unit 3
- 17 E 37th St Unit 12
- 509 W 40th St
- 407 W 35th St
- 501 W 42nd St