Estimated Value: $414,000 - $463,000
5
Beds
4
Baths
2,016
Sq Ft
$215/Sq Ft
Est. Value
About This Home
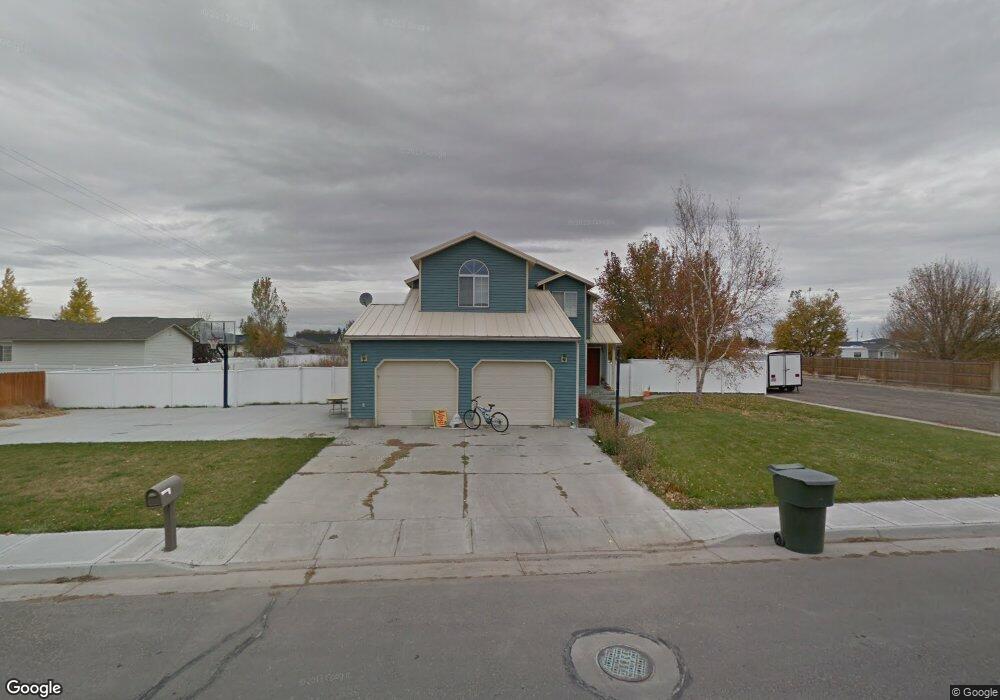
This home is located at 210 W 4th N, Rigby, ID 83442 and is currently estimated at $432,571, approximately $214 per square foot. 210 W 4th N is a home located in Jefferson County with nearby schools including Harwood Elementary School, Rigby Middle School, and Rigby High School.
Ownership History
Date
Name
Owned For
Owner Type
Purchase Details
Closed on
Apr 21, 2023
Sold by
Tee Time Storage Llc
Bought by
Sorensen Jon K and Sorensen Tiffany June
Current Estimated Value
Purchase Details
Closed on
Jul 18, 2018
Sold by
Swanson Raymond Brent and Swanson Lisa Kaye
Bought by
Sorensen Jon and Sorensen Tiffany
Home Financials for this Owner
Home Financials are based on the most recent Mortgage that was taken out on this home.
Original Mortgage
$242,622
Interest Rate
4.37%
Mortgage Type
FHA
Create a Home Valuation Report for This Property
The Home Valuation Report is an in-depth analysis detailing your home's value as well as a comparison with similar homes in the area
Home Values in the Area
Average Home Value in this Area
Purchase History
| Date | Buyer | Sale Price | Title Company |
|---|---|---|---|
| Sorensen Jon K | -- | Alliance Title | |
| Sorensen Jon | -- | First American Title Company |
Source: Public Records
Mortgage History
| Date | Status | Borrower | Loan Amount |
|---|---|---|---|
| Previous Owner | Sorensen Jon | $242,622 |
Source: Public Records
Tax History
| Year | Tax Paid | Tax Assessment Tax Assessment Total Assessment is a certain percentage of the fair market value that is determined by local assessors to be the total taxable value of land and additions on the property. | Land | Improvement |
|---|---|---|---|---|
| 2025 | $2,130 | $448,618 | $0 | $0 |
| 2024 | $2,130 | $431,182 | $0 | $0 |
| 2023 | $2,639 | $441,724 | $0 | $0 |
| 2022 | $3,459 | $397,643 | $0 | $0 |
| 2021 | $3,075 | $309,095 | $0 | $0 |
| 2020 | $2,568 | $275,887 | $0 | $0 |
| 2019 | $2,683 | $244,346 | $0 | $0 |
| 2018 | $2,102 | $203,487 | $0 | $0 |
| 2017 | $2,021 | $190,110 | $0 | $0 |
| 2016 | $1,967 | $91,645 | $0 | $0 |
| 2015 | $1,897 | $84,259 | $0 | $0 |
| 2014 | $1,873 | $83,294 | $0 | $0 |
| 2013 | -- | $75,581 | $0 | $0 |
Source: Public Records
Map
Nearby Homes
Your Personal Tour Guide
Ask me questions while you tour the home.