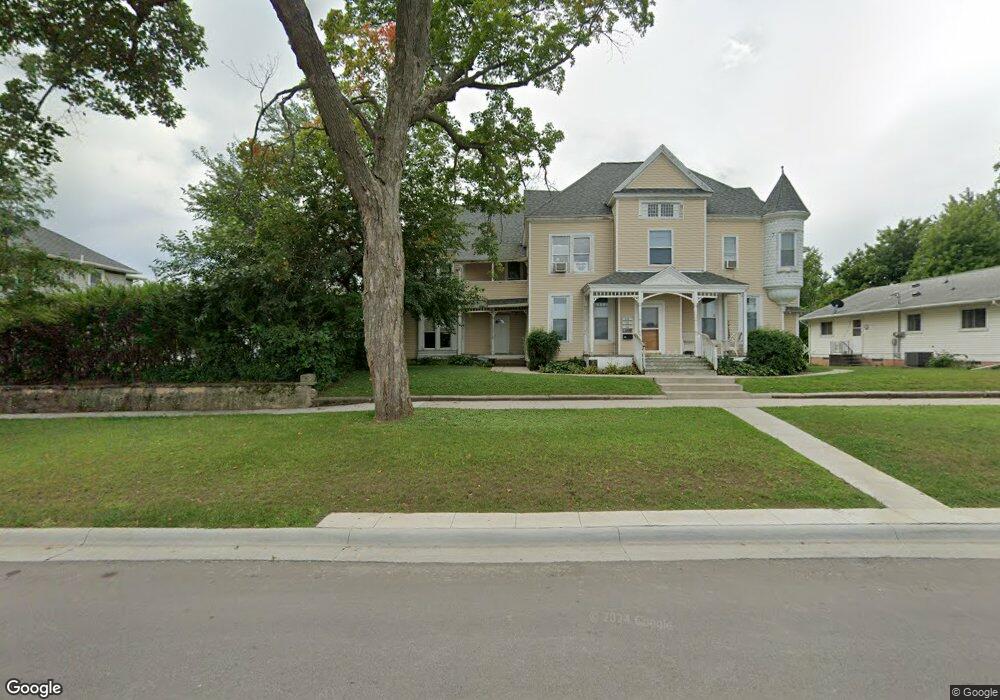
210 W 6th St Vinton, IA 52349
Estimated Value: $165,000 - $214,000
7
Beds
4
Baths
4,034
Sq Ft
$47/Sq Ft
Est. Value
About This Home
This home is located at 210 W 6th St, Vinton, IA 52349 and is currently estimated at $189,500, approximately $46 per square foot. 210 W 6th St is a home located in Benton County with nearby schools including Tilford Elementary School, Shellsburg Elementary School, and Vinton-Shellsburg Middle School.
Ownership History
Date
Name
Owned For
Owner Type
Purchase Details
Closed on
Jan 19, 2010
Sold by
Lc Properties L L C
Bought by
Hesson Properties L L C
Current Estimated Value
Home Financials for this Owner
Home Financials are based on the most recent Mortgage that was taken out on this home.
Original Mortgage
$50,000
Outstanding Balance
$32,911
Interest Rate
5%
Mortgage Type
Purchase Money Mortgage
Estimated Equity
$156,589
Create a Home Valuation Report for This Property
The Home Valuation Report is an in-depth analysis detailing your home's value as well as a comparison with similar homes in the area
Home Values in the Area
Average Home Value in this Area
Purchase History
| Date | Buyer | Sale Price | Title Company |
|---|---|---|---|
| Hesson Properties L L C | $5,000 | None Available |
Source: Public Records
Mortgage History
| Date | Status | Borrower | Loan Amount |
|---|---|---|---|
| Open | Hesson Properties L L C | $50,000 |
Source: Public Records
Tax History Compared to Growth
Tax History
| Year | Tax Paid | Tax Assessment Tax Assessment Total Assessment is a certain percentage of the fair market value that is determined by local assessors to be the total taxable value of land and additions on the property. | Land | Improvement |
|---|---|---|---|---|
| 2025 | $2,326 | $150,000 | $11,900 | $138,100 |
| 2024 | $2,278 | $124,100 | $11,900 | $112,200 |
| 2023 | $2,160 | $124,100 | $11,900 | $112,200 |
| 2022 | $2,612 | $100,400 | $9,500 | $90,900 |
| 2021 | $2,612 | $100,400 | $9,500 | $90,900 |
| 2020 | $2,766 | $98,800 | $9,500 | $89,300 |
| 2019 | $2,724 | $98,800 | $9,500 | $89,300 |
| 2018 | $2,844 | $94,300 | $9,500 | $84,800 |
| 2017 | $2,844 | $94,300 | $9,500 | $84,800 |
| 2016 | $2,152 | $64,300 | $10,700 | $53,600 |
| 2015 | $2,152 | $64,300 | $10,700 | $53,600 |
| 2014 | $2,246 | $64,300 | $0 | $0 |
Source: Public Records
Map
Nearby Homes