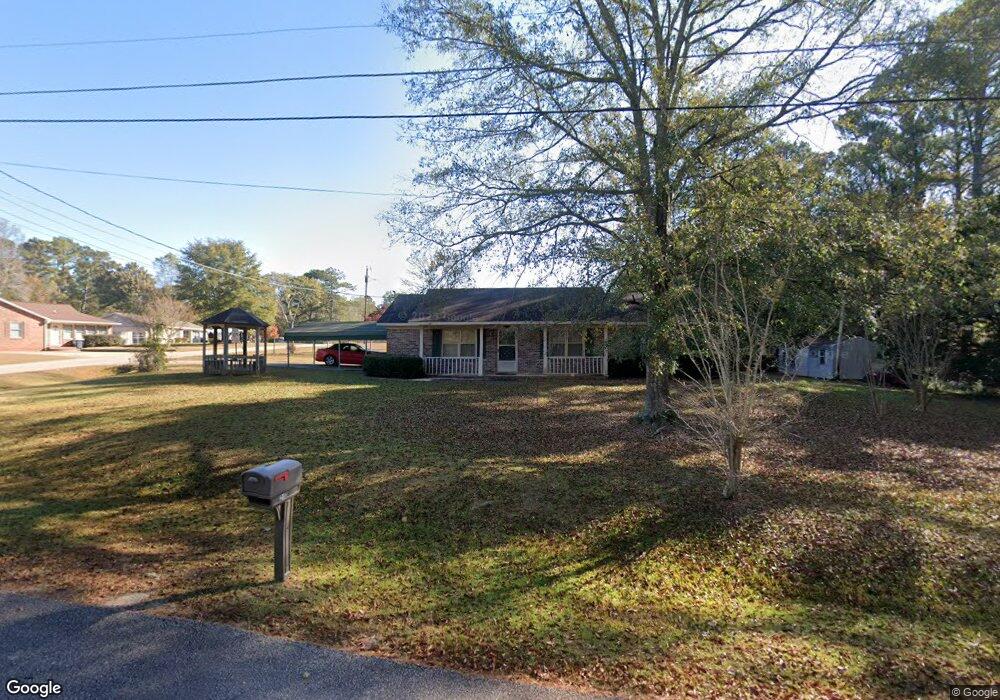
210 W Lakeview Dr Lagrange, GA 30240
Estimated Value: $181,000 - $229,000
3
Beds
2
Baths
1,269
Sq Ft
$158/Sq Ft
Est. Value
About This Home
This home is located at 210 W Lakeview Dr, Lagrange, GA 30240 and is currently estimated at $201,104, approximately $158 per square foot. 210 W Lakeview Dr is a home located in Troup County with nearby schools including Ethel W. Kight Elementary School, Hollis Hand Elementary School, and Franklin Forest Elementary School.
Ownership History
Date
Name
Owned For
Owner Type
Purchase Details
Closed on
Apr 30, 2008
Sold by
Ford Roy Michael
Bought by
Bryan William S and Bryan Susan
Current Estimated Value
Home Financials for this Owner
Home Financials are based on the most recent Mortgage that was taken out on this home.
Original Mortgage
$89,500
Outstanding Balance
$55,861
Interest Rate
5.86%
Mortgage Type
New Conventional
Estimated Equity
$145,243
Purchase Details
Closed on
Sep 15, 1997
Sold by
Roy C Ford
Bought by
Ford Executor Roy Michael Ford
Purchase Details
Closed on
Oct 29, 1977
Sold by
Williams Douglas C and Williams Louise W
Bought by
Roy C Ford
Purchase Details
Closed on
Jun 7, 1976
Sold by
Marion Foster
Bought by
Williams Douglas C and Williams Louise W
Purchase Details
Closed on
Nov 14, 1975
Sold by
Jesse Bassett
Bought by
Marion Foster
Purchase Details
Closed on
Jan 1, 1963
Sold by
Wm L Hutchinson
Bought by
Jesse Bassett
Create a Home Valuation Report for This Property
The Home Valuation Report is an in-depth analysis detailing your home's value as well as a comparison with similar homes in the area
Purchase History
| Date | Buyer | Sale Price | Title Company |
|---|---|---|---|
| Bryan William S | $112,000 | -- | |
| Ford Executor Roy Michael Ford | -- | -- | |
| Roy C Ford | $34,000 | -- | |
| Williams Douglas C | -- | -- | |
| Marion Foster | -- | -- | |
| Jesse Bassett | -- | -- |
Source: Public Records
Mortgage History
| Date | Status | Borrower | Loan Amount |
|---|---|---|---|
| Open | Bryan William S | $89,500 |
Source: Public Records
Tax History
| Year | Tax Paid | Tax Assessment Tax Assessment Total Assessment is a certain percentage of the fair market value that is determined by local assessors to be the total taxable value of land and additions on the property. | Land | Improvement |
|---|---|---|---|---|
| 2025 | $1,407 | $65,980 | $10,000 | $55,980 |
| 2024 | $1,083 | $47,512 | $10,000 | $37,512 |
| 2023 | $1,064 | $46,848 | $10,000 | $36,848 |
| 2022 | $1,037 | $44,888 | $10,000 | $34,888 |
| 2021 | $896 | $37,460 | $10,000 | $27,460 |
| 2020 | $775 | $33,460 | $6,000 | $27,460 |
| 2019 | $776 | $33,496 | $6,000 | $27,496 |
| 2018 | $694 | $30,756 | $7,760 | $22,996 |
| 2017 | $693 | $30,712 | $7,716 | $22,996 |
| 2016 | $670 | $29,949 | $7,716 | $22,233 |
| 2015 | $670 | $29,949 | $7,716 | $22,233 |
| 2014 | $634 | $28,778 | $7,716 | $21,062 |
| 2013 | -- | $30,268 | $7,716 | $22,552 |
Source: Public Records
Map
Nearby Homes
- 3 Reed Dr
- 223 Pinehaven Dr
- 0 Unit 10514554
- 117 Brookwood Dr
- 336 Whitaker Rd
- 104 Spring Valley Dr
- 427 Fling Rd
- 8 Horace Carter Rd
- 641 Whitaker Rd
- 200 Cheyenne Dr
- 0 Bradfield Dr Unit 10568803
- 509 Connie Dr
- 203 Shawnee Dr
- 0 Hills and Dales Farm Rd
- 808 S Fling Rd
- 214 Willowcrest Way
- 101 Crown St Unit LOT 5
- 102 Crown St Unit LOT 1
- 217 Highland Trail
- 107 Clark St
- 204 E Lakeview Dr
- 208 W Lakeview Dr
- 207 W Lakeview Dr
- 212 W Lakeview Dr
- 206 E Lakeview Dr
- 206 W Lakeview Dr
- 211 W Lakeview Dr
- 213 E Lakeview Dr
- 205 W Lakeview Dr
- 214 W Lakeview Dr
- 215 E Lakeview Dr
- 222 E Lakeview Dr
- 204 W Lakeview Dr
- 213 W Lakeview Dr
- 216 W Lakeview Dr
- 203 W Lakeview Dr
- 217 E Lakeview Dr
- 215 W Lakeview Dr
- 218 W Lakeview Dr
- 2392 Roanoke Rd
Your Personal Tour Guide
Ask me questions while you tour the home.