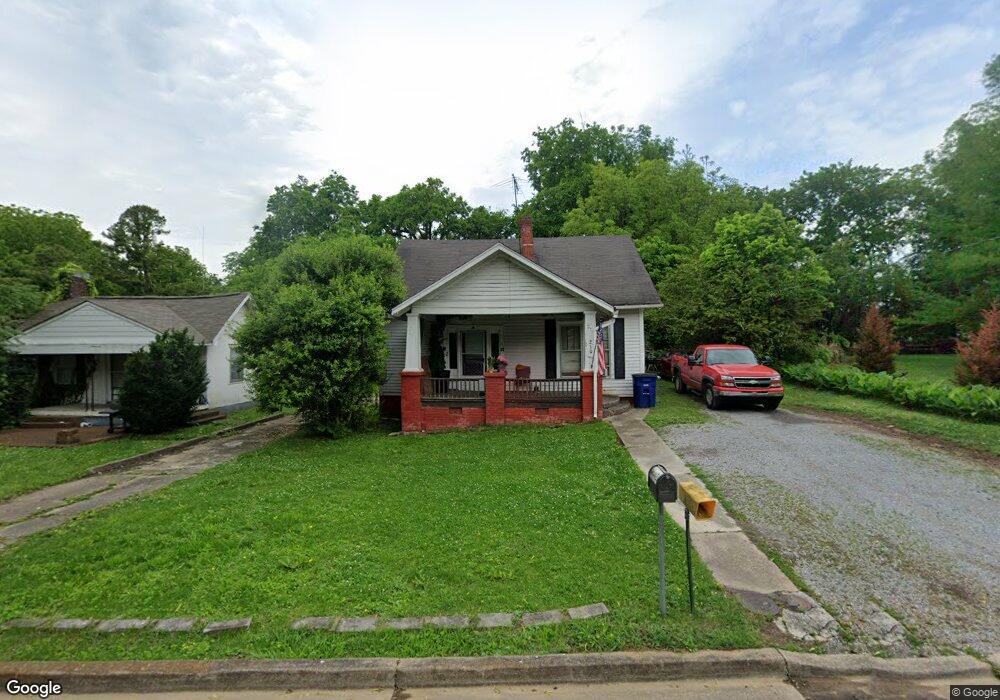
210 Walnut St Shelbyville, TN 37160
Estimated Value: $114,000 - $238,000
--
Bed
1
Bath
1,434
Sq Ft
$124/Sq Ft
Est. Value
About This Home
This home is located at 210 Walnut St, Shelbyville, TN 37160 and is currently estimated at $177,883, approximately $124 per square foot. 210 Walnut St is a home located in Bedford County with nearby schools including East Side Elementary School, Harris Middle School, and Christian Chapel Academy.
Ownership History
Date
Name
Owned For
Owner Type
Purchase Details
Closed on
Apr 18, 2018
Sold by
Boles Paul and Boles Miriam
Bought by
Boles Paul M
Current Estimated Value
Purchase Details
Closed on
Jul 9, 2014
Sold by
Mcconnell Donny
Bought by
Boles Paul
Home Financials for this Owner
Home Financials are based on the most recent Mortgage that was taken out on this home.
Original Mortgage
$23,200
Outstanding Balance
$17,686
Interest Rate
4.26%
Mortgage Type
New Conventional
Estimated Equity
$160,197
Purchase Details
Closed on
Oct 3, 2013
Sold by
Hudson Lester Wayne
Bought by
Mcconnell Sue M Le and Mcconnell J
Purchase Details
Closed on
Aug 14, 2001
Sold by
Mcconnell Sue M
Bought by
Hudson Judy
Purchase Details
Closed on
Feb 13, 1966
Bought by
Mcconnell Raymond V and Mcconnell Sue
Create a Home Valuation Report for This Property
The Home Valuation Report is an in-depth analysis detailing your home's value as well as a comparison with similar homes in the area
Home Values in the Area
Average Home Value in this Area
Purchase History
| Date | Buyer | Sale Price | Title Company |
|---|---|---|---|
| Boles Paul M | -- | None Available | |
| Boles Paul | $29,000 | -- | |
| Mcconnell Sue M Le | -- | -- | |
| Hudson Judy | -- | -- | |
| Mcconnell Raymond V | -- | -- |
Source: Public Records
Mortgage History
| Date | Status | Borrower | Loan Amount |
|---|---|---|---|
| Open | Boles Paul | $23,200 |
Source: Public Records
Tax History Compared to Growth
Tax History
| Year | Tax Paid | Tax Assessment Tax Assessment Total Assessment is a certain percentage of the fair market value that is determined by local assessors to be the total taxable value of land and additions on the property. | Land | Improvement |
|---|---|---|---|---|
| 2025 | -- | $23,175 | $0 | $0 |
| 2024 | -- | $23,175 | $4,050 | $19,125 |
| 2023 | $882 | $23,175 | $4,050 | $19,125 |
| 2022 | $907 | $23,175 | $4,050 | $19,125 |
| 2021 | $823 | $23,175 | $4,050 | $19,125 |
| 2020 | $636 | $23,175 | $4,050 | $19,125 |
| 2019 | $636 | $14,375 | $2,125 | $12,250 |
| 2018 | $622 | $14,375 | $2,125 | $12,250 |
| 2017 | $622 | $14,375 | $2,125 | $12,250 |
| 2016 | $617 | $14,375 | $2,125 | $12,250 |
| 2015 | $617 | $14,375 | $2,125 | $12,250 |
| 2014 | $581 | $14,830 | $0 | $0 |
Source: Public Records
Map
Nearby Homes
- 220 Walnut St
- 0 E Depot St
- 709 Belmont Ave
- 120 Dogwood Ct
- 112 Elizabeth St
- 464 Whitthorne St
- 207 Martha St
- 211 S Fairoak St
- 527 Deery St
- 102 Germantown Rd
- 627 E Lane St
- 631 E Lane St
- 222 Carter St
- 215 Coney Island Rd
- 314 Maplewood Dr
- 713 King Ave
- 714 King Ave
- 418 Riverview Dr
- 724 Alton Ave
- 636 Deery St
- 212 Walnut St
- 211 Walnut St
- 209 Walnut St
- 207 Walnut St #B
- 207 Walnut St
- 207 Walnut St Unit B
- 422 Belmont Ave
- 216 Walnut St
- 502 Belmont Ave
- 504 Belmont Ave
- 506 Belmont Ave
- 419 Elliott St
- 417 Elliott St
- 118 Walnut St
- 415 Elliott St
- 416 Belmont Ave
- 508 Belmont Ave
- 505 Belmont Ave # 505
- 411 Elliott St
- 510 Belmont Ave