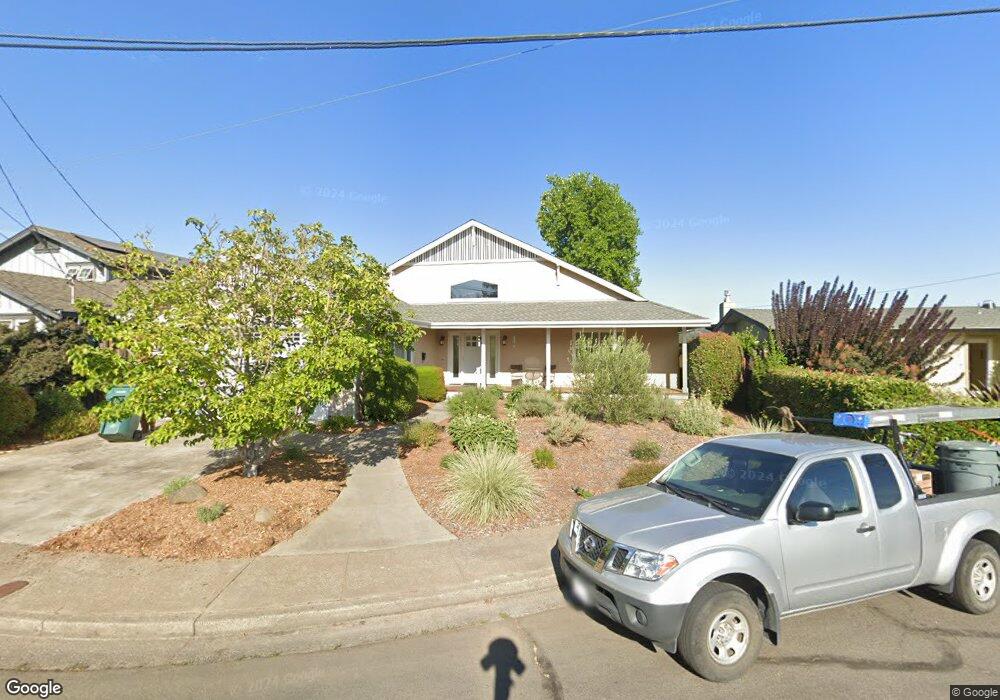
210 Wilking Way Sonoma, CA 95476
Estimated Value: $1,404,025 - $2,213,000
3
Beds
2
Baths
2,205
Sq Ft
$756/Sq Ft
Est. Value
About This Home
This home is located at 210 Wilking Way, Sonoma, CA 95476 and is currently estimated at $1,667,256, approximately $756 per square foot. 210 Wilking Way is a home located in Sonoma County with nearby schools including Prestwood Elementary School, Adele Harrison Middle School, and Creekside High School.
Ownership History
Date
Name
Owned For
Owner Type
Purchase Details
Closed on
Sep 9, 2002
Sold by
Fredrickson Barbara L
Bought by
Fredrickson Barbara L and The Fredrickson Family Revocab
Current Estimated Value
Home Financials for this Owner
Home Financials are based on the most recent Mortgage that was taken out on this home.
Original Mortgage
$275,000
Outstanding Balance
$114,877
Interest Rate
6.24%
Estimated Equity
$1,552,379
Purchase Details
Closed on
Jul 20, 2001
Sold by
Fredrickson Barbara L
Bought by
Fredrickson Barbara L and The Fredrickson Family Revocab
Purchase Details
Closed on
Jul 6, 1999
Sold by
Berdan Mabel K Revocable 1991 Trust and Helen D
Bought by
Fredrickson Richard D and Fredrickson Barbara L
Home Financials for this Owner
Home Financials are based on the most recent Mortgage that was taken out on this home.
Original Mortgage
$325,000
Interest Rate
7.24%
Mortgage Type
Seller Take Back
Create a Home Valuation Report for This Property
The Home Valuation Report is an in-depth analysis detailing your home's value as well as a comparison with similar homes in the area
Home Values in the Area
Average Home Value in this Area
Purchase History
| Date | Buyer | Sale Price | Title Company |
|---|---|---|---|
| Fredrickson Barbara L | -- | New Century Title Co | |
| Fredrickson Barbara L | -- | New Century Title Co | |
| Fredrickson Barbara L | -- | -- | |
| Fredrickson Richard D | $350,000 | First American Title |
Source: Public Records
Mortgage History
| Date | Status | Borrower | Loan Amount |
|---|---|---|---|
| Open | Fredrickson Barbara L | $275,000 | |
| Closed | Fredrickson Richard D | $325,000 |
Source: Public Records
Tax History Compared to Growth
Tax History
| Year | Tax Paid | Tax Assessment Tax Assessment Total Assessment is a certain percentage of the fair market value that is determined by local assessors to be the total taxable value of land and additions on the property. | Land | Improvement |
|---|---|---|---|---|
| 2025 | $8,826 | $688,627 | $215,175 | $473,452 |
| 2024 | $8,826 | $675,125 | $210,956 | $464,169 |
| 2023 | $8,826 | $661,888 | $206,820 | $455,068 |
| 2022 | $8,566 | $648,911 | $202,765 | $446,146 |
| 2021 | $8,300 | $636,189 | $198,790 | $437,399 |
| 2020 | $8,267 | $629,667 | $196,752 | $432,915 |
| 2019 | $8,083 | $617,322 | $192,895 | $424,427 |
| 2018 | $8,241 | $605,218 | $189,113 | $416,105 |
| 2017 | $7,881 | $593,352 | $185,405 | $407,947 |
| 2016 | $7,443 | $581,719 | $181,770 | $399,949 |
| 2015 | $7,144 | $572,982 | $179,040 | $393,942 |
| 2014 | $7,021 | $561,759 | $175,533 | $386,226 |
Source: Public Records
Map
Nearby Homes
- 200 Wilking Way
- 220 Wilking Way
- 232 Wilking Way
- 190 Wilking Way
- 242 Wilking Way
- 180 Wilking Way
- 201 Wilking Way
- 221 Wilking Way
- 231 Wilking Way
- 252 Wilking Way
- 170 Wilking Way
- 241 Wilking Way
- 185 Wilking Way
- 445 Greve Ln
- 450 Lucca Ct
- 251 Wilking Way
- 264 Wilking Way
- 175 Wilking Way
- 160 Wilking Way
- 450 Greve Ln