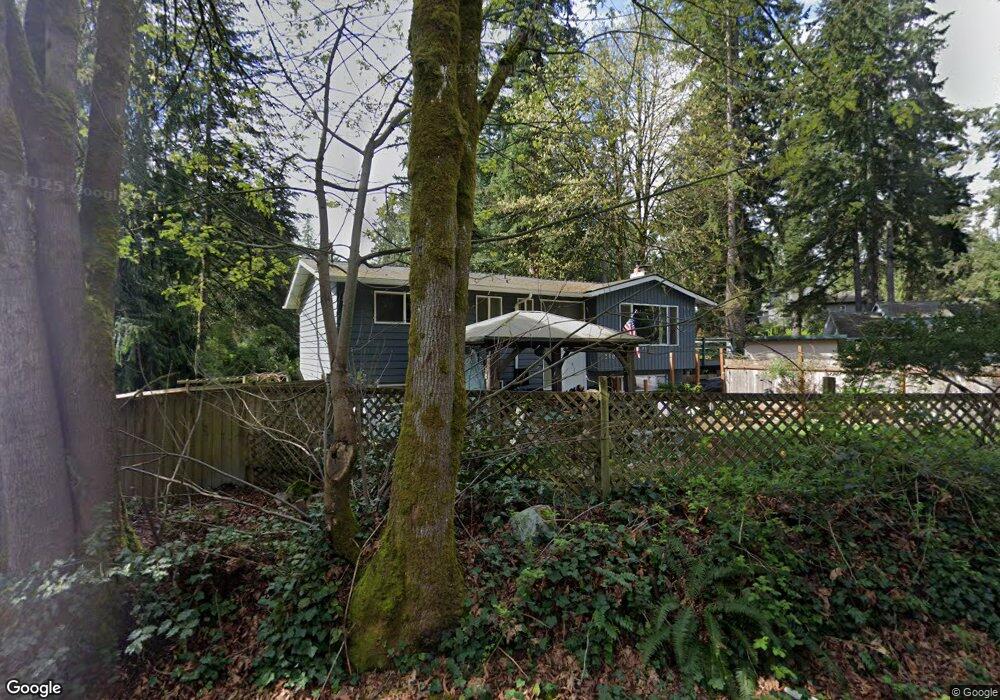
210 Winesap Rd Bothell, WA 98012
Queensborough-Brentwood NeighborhoodEstimated Value: $751,000 - $865,000
5
Beds
3
Baths
2,146
Sq Ft
$381/Sq Ft
Est. Value
About This Home
This home is located at 210 Winesap Rd, Bothell, WA 98012 and is currently estimated at $818,232, approximately $381 per square foot. 210 Winesap Rd is a home located in Snohomish County with nearby schools including Frank Love Elementary School, Kenmore Middle School, and Bothell High School.
Ownership History
Date
Name
Owned For
Owner Type
Purchase Details
Closed on
Jul 19, 2007
Sold by
Young Martin F
Bought by
Hay Peter S and Hay Wen T
Current Estimated Value
Home Financials for this Owner
Home Financials are based on the most recent Mortgage that was taken out on this home.
Original Mortgage
$365,000
Outstanding Balance
$230,863
Interest Rate
6.73%
Mortgage Type
Purchase Money Mortgage
Estimated Equity
$587,369
Purchase Details
Closed on
Apr 27, 2006
Sold by
Young Jennifer J
Bought by
Young Martin F
Home Financials for this Owner
Home Financials are based on the most recent Mortgage that was taken out on this home.
Original Mortgage
$72,000
Interest Rate
5.96%
Mortgage Type
Stand Alone Second
Purchase Details
Closed on
Jul 15, 2001
Sold by
Kemper Frances M
Bought by
Kemper Properties Llc
Create a Home Valuation Report for This Property
The Home Valuation Report is an in-depth analysis detailing your home's value as well as a comparison with similar homes in the area
Home Values in the Area
Average Home Value in this Area
Purchase History
| Date | Buyer | Sale Price | Title Company |
|---|---|---|---|
| Hay Peter S | $365,000 | Ticor Title Company | |
| Young Martin F | -- | Chicago | |
| Young Martin F | $360,280 | Chicago Title | |
| Kemper Properties Llc | -- | -- |
Source: Public Records
Mortgage History
| Date | Status | Borrower | Loan Amount |
|---|---|---|---|
| Open | Hay Peter S | $365,000 | |
| Previous Owner | Young Martin F | $72,000 | |
| Previous Owner | Young Martin F | $288,000 | |
| Previous Owner | Young Martin F | $72,000 |
Source: Public Records
Tax History
| Year | Tax Paid | Tax Assessment Tax Assessment Total Assessment is a certain percentage of the fair market value that is determined by local assessors to be the total taxable value of land and additions on the property. | Land | Improvement |
|---|---|---|---|---|
| 2025 | $6,013 | $720,700 | $490,000 | $230,700 |
| 2024 | $6,013 | $702,900 | $480,000 | $222,900 |
| 2023 | $6,226 | $787,700 | $530,000 | $257,700 |
| 2022 | $5,814 | $590,100 | $369,000 | $221,100 |
| 2020 | $5,269 | $481,300 | $289,000 | $192,300 |
| 2019 | $4,705 | $433,000 | $247,000 | $186,000 |
| 2018 | $4,401 | $381,500 | $215,000 | $166,500 |
| 2017 | $3,819 | $333,400 | $180,000 | $153,400 |
| 2016 | $3,548 | $301,600 | $158,000 | $143,600 |
Source: Public Records
Map
Nearby Homes
- 19221 Meridian Dr SE Unit CW 16
- 19228 Meridian Dr SE Unit CW 10
- 19112 Meridian Dr SE Unit CW 01
- 19220 Meridian Dr SE Unit CW 08
- 306 Poppy Rd
- 303 Poppy Rd
- 525 192nd Place SE
- 603 194th Place SE
- 18517 1st Ave SE
- 18627 Meridian Place W
- 19726 Filbert Dr
- 18425 Meridian Ave SE Unit CR 26
- 18510 Meridian Ave SE Unit CR 02
- 18504 Meridian Ave SE Unit CR 01
- 18518 Meridian Ave SE Unit CR 03
- 18421 Meridian Ave SE Unit CR 27
- 122 185th Place SW
- 24 199th Place SE
- 18320 3rd Dr SE
- 727 198th Place SE
- 222 Winesap Rd
- 220 Winesap Rd
- 19212 2nd Ave SE
- 19220 2nd Ave SE
- 19218 2nd Ave SE
- 19122 2nd Ave SE
- 226 Winesap Rd
- 19205 2nd Ave SE
- 19210 2nd Ave SE
- 19114 2nd Ave SE
- 19133 2nd Ave SE
- 19226 2nd Ave SE
- 19215 Winesap Rd
- 19129 1st Dr SE Unit A
- 19129 1st Dr SE Unit B
- 131 Winesap Rd
- 19121 1st Dr SE Unit A
- 19121 1st Dr SE
- 128 Winesap Rd
- 132 Winesap Rd
Your Personal Tour Guide
Ask me questions while you tour the home.