Estimated Value: $505,000 - $577,000
Studio
3
Baths
1,959
Sq Ft
$281/Sq Ft
Est. Value
About This Home
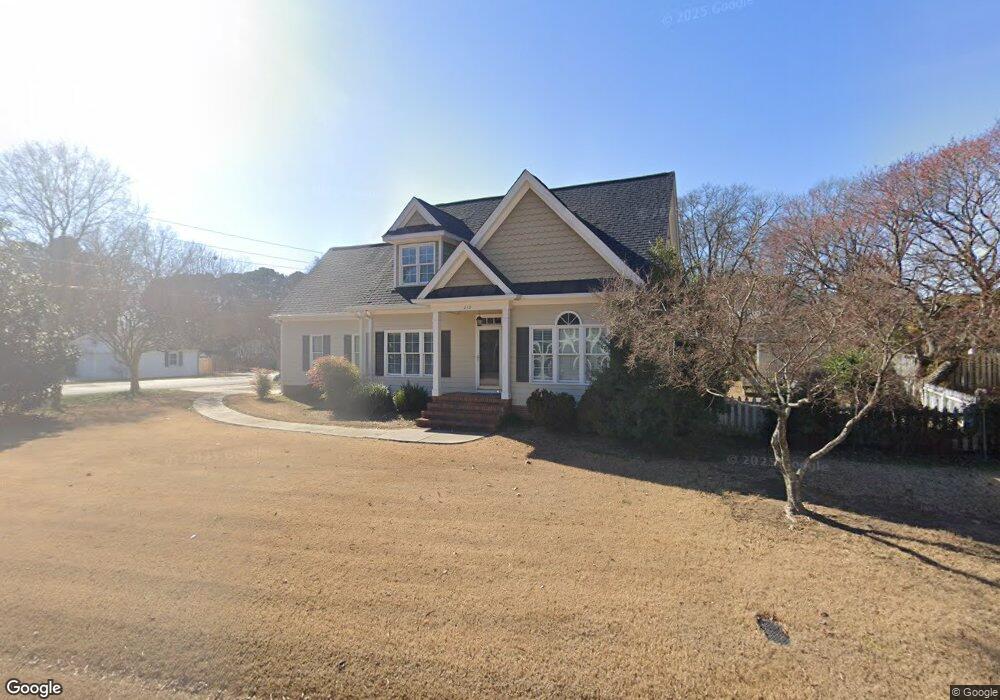
This home is located at 210 Wrenn St, Apex, NC 27502 and is currently estimated at $550,921, approximately $281 per square foot. 210 Wrenn St is a home located in Wake County with nearby schools including Apex Elementary School, Apex Middle, and Apex High School.
Ownership History
Date
Name
Owned For
Owner Type
Purchase Details
Closed on
Apr 11, 2002
Sold by
Tin Inc
Bought by
Hicks Ray F and Hicks Virginia R
Current Estimated Value
Purchase Details
Closed on
Sep 14, 1999
Sold by
Jvi Residential Construction Inc
Bought by
Hicks Ray F and Hicks Virginia R
Home Financials for this Owner
Home Financials are based on the most recent Mortgage that was taken out on this home.
Original Mortgage
$32,000
Interest Rate
7.89%
Mortgage Type
Construction
Purchase Details
Closed on
Mar 5, 1998
Sold by
Empire Development Co Inc
Bought by
Hicks Ray F and Hicks Virginia R
Home Financials for this Owner
Home Financials are based on the most recent Mortgage that was taken out on this home.
Original Mortgage
$30,000
Interest Rate
7.07%
Mortgage Type
Construction
Purchase Details
Closed on
Nov 18, 1997
Sold by
Empire Development Co Inc
Bought by
Hicks Ray F and Hicks Virginia R
Create a Home Valuation Report for This Property
The Home Valuation Report is an in-depth analysis detailing your home's value as well as a comparison with similar homes in the area
Purchase History
| Date | Buyer | Sale Price | Title Company |
|---|---|---|---|
| Hicks Ray F | $134,000 | -- | |
| Hicks Ray F | $42,000 | -- | |
| Hicks Ray F | $43,500 | -- | |
| Hicks Ray F | $81,000 | -- |
Source: Public Records
Mortgage History
| Date | Status | Borrower | Loan Amount |
|---|---|---|---|
| Previous Owner | Hicks Ray F | $32,000 | |
| Previous Owner | Hicks Ray F | $30,000 |
Source: Public Records
Tax History
| Year | Tax Paid | Tax Assessment Tax Assessment Total Assessment is a certain percentage of the fair market value that is determined by local assessors to be the total taxable value of land and additions on the property. | Land | Improvement |
|---|---|---|---|---|
| 2025 | $5,241 | $598,012 | $230,000 | $368,012 |
| 2024 | $5,124 | $598,012 | $230,000 | $368,012 |
Source: Public Records
Map
Nearby Homes
- 314 Wrenn St
- 105 Cunningham St
- 102 Briarcliff St
- 107 N Ellington St
- 909 Bryn Mawr Ct
- 311 Culvert St
- 309 Culvert St
- 307 S Elm St
- 327 Old Mill Village Dr
- 631 Sawcut Ln
- 635 Sawcut Ln
- 633 Sawcut Ln
- 514 Mill Hopper Ln
- 406 S Salem St
- 229 Old Grove Ln
- 300 Pate St
- 547 Grand Central Station
- 1434 Salem Creek Dr
- 345 Great Northern Station
- 596 Grand Central Station
- 204 Wrenn St
- 213 S Tunstall Ave
- 302 Wrenn St
- 213 Wrenn St
- 209 S Tunstall Ave
- 303 S Tunstall Ave
- 205 S Tunstall Ave
- 303 Wrenn St
- 704 Olive St
- 304 Wrenn St
- 201 S Tunstall St
- 309 S Tunstall Ave
- 214 S Tunstall Ave
- 203 Wrenn St
- 201 S Tunstall Ave
- 206 S Tunstall Ave
- 302 S Tunstall Ave
- 305 Wrenn St
- 304 S Tunstall Ave
- 608 Olive St
Your Personal Tour Guide
Ask me questions while you tour the home.