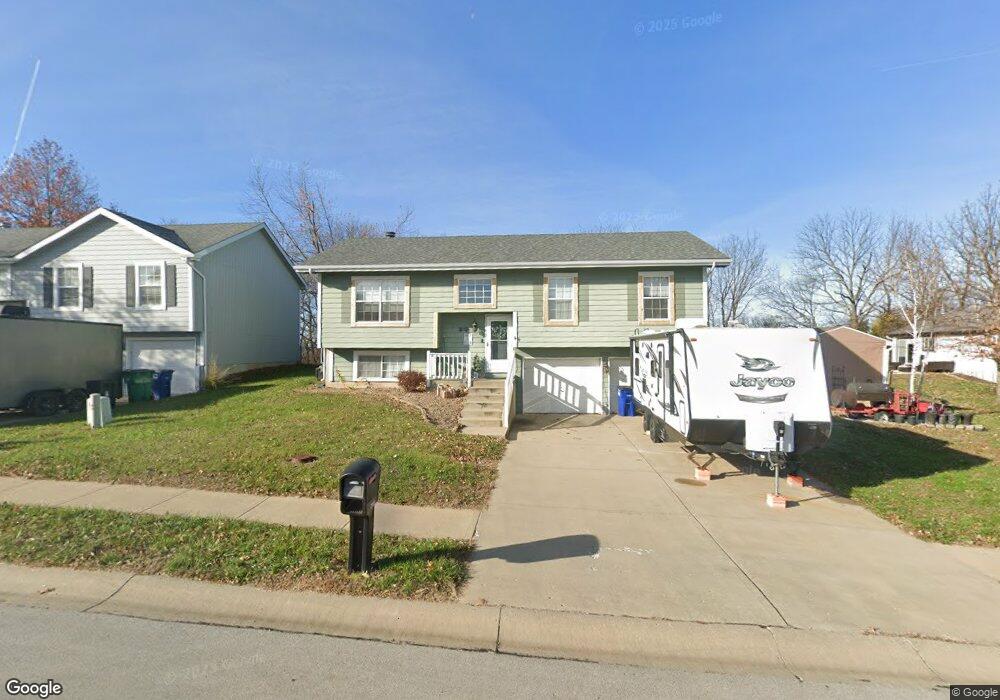
2100 Catie Ln Platte City, MO 64079
Estimated Value: $269,357 - $304,000
3
Beds
2
Baths
1,214
Sq Ft
$236/Sq Ft
Est. Value
About This Home
This home is located at 2100 Catie Ln, Platte City, MO 64079 and is currently estimated at $286,339, approximately $235 per square foot. 2100 Catie Ln is a home located in Platte County with nearby schools including Platte County High School.
Ownership History
Date
Name
Owned For
Owner Type
Purchase Details
Closed on
Sep 12, 2016
Sold by
Jones Sandra Rene
Bought by
Jones Sandra Rene
Current Estimated Value
Home Financials for this Owner
Home Financials are based on the most recent Mortgage that was taken out on this home.
Original Mortgage
$130,240
Outstanding Balance
$105,087
Interest Rate
3.75%
Mortgage Type
FHA
Estimated Equity
$181,252
Purchase Details
Closed on
Sep 24, 2009
Sold by
Gallamore John W and Gallamore Renne L
Bought by
Jones Sandra Rene
Home Financials for this Owner
Home Financials are based on the most recent Mortgage that was taken out on this home.
Original Mortgage
$137,755
Interest Rate
5.12%
Mortgage Type
New Conventional
Create a Home Valuation Report for This Property
The Home Valuation Report is an in-depth analysis detailing your home's value as well as a comparison with similar homes in the area
Home Values in the Area
Average Home Value in this Area
Purchase History
| Date | Buyer | Sale Price | Title Company |
|---|---|---|---|
| Jones Sandra Rene | -- | Vision Title Llc | |
| Jones Sandra Rene | -- | -- |
Source: Public Records
Mortgage History
| Date | Status | Borrower | Loan Amount |
|---|---|---|---|
| Open | Jones Sandra Rene | $130,240 | |
| Closed | Jones Sandra Rene | $137,755 |
Source: Public Records
Tax History Compared to Growth
Tax History
| Year | Tax Paid | Tax Assessment Tax Assessment Total Assessment is a certain percentage of the fair market value that is determined by local assessors to be the total taxable value of land and additions on the property. | Land | Improvement |
|---|---|---|---|---|
| 2024 | $2,650 | $34,707 | $5,429 | $29,278 |
| 2023 | $2,650 | $34,707 | $5,429 | $29,278 |
| 2022 | $2,338 | $30,311 | $5,429 | $24,882 |
| 2021 | $2,362 | $30,311 | $5,429 | $24,882 |
| 2020 | $2,121 | $26,895 | $4,649 | $22,246 |
| 2019 | $2,121 | $26,895 | $4,649 | $22,246 |
| 2018 | $2,239 | $28,196 | $3,800 | $24,396 |
| 2017 | $2,229 | $28,196 | $3,800 | $24,396 |
| 2016 | $2,217 | $28,196 | $3,800 | $24,396 |
| 2015 | $2,216 | $28,196 | $3,800 | $24,396 |
| 2013 | $2,042 | $28,196 | $0 | $0 |
Source: Public Records
Map
Nearby Homes