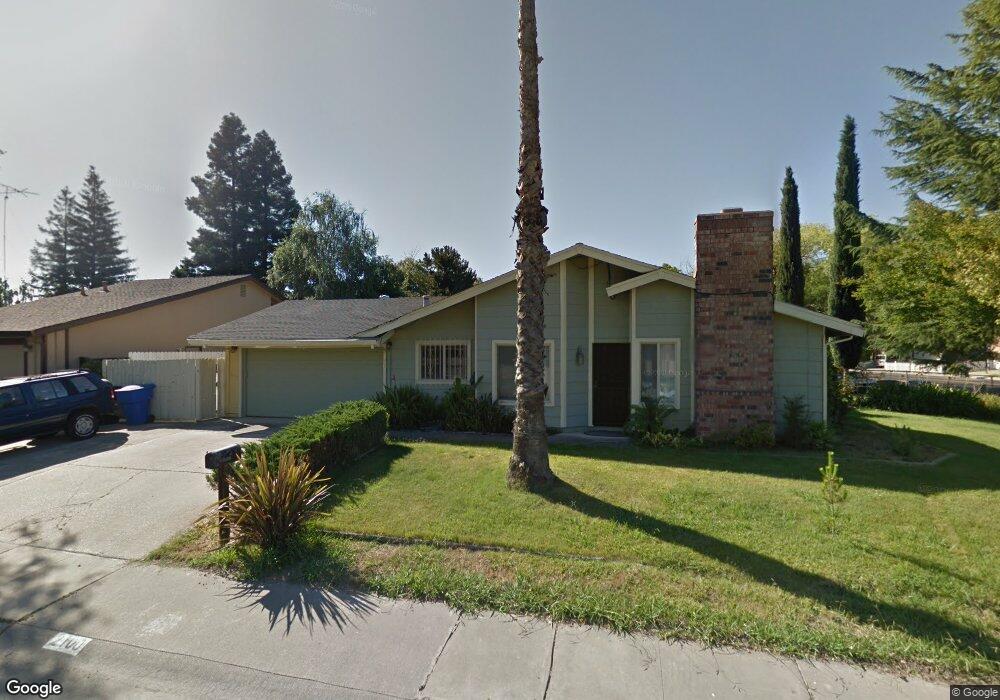
2100 Delgado Way Sacramento, CA 95833
Frates Ranch NeighborhoodEstimated Value: $256,000 - $439,000
3
Beds
2
Baths
1,173
Sq Ft
$331/Sq Ft
Est. Value
About This Home
This home is located at 2100 Delgado Way, Sacramento, CA 95833 and is currently estimated at $387,846, approximately $330 per square foot. 2100 Delgado Way is a home located in Sacramento County with nearby schools including Bannon Creek Elementary School, Natomas High School, and READ Academy of Sacramento.
Ownership History
Date
Name
Owned For
Owner Type
Purchase Details
Closed on
Oct 26, 2002
Sold by
Ramirez Asuncion
Bought by
Sabala Tony R
Current Estimated Value
Home Financials for this Owner
Home Financials are based on the most recent Mortgage that was taken out on this home.
Original Mortgage
$97,000
Outstanding Balance
$40,539
Interest Rate
5.99%
Estimated Equity
$347,307
Purchase Details
Closed on
Nov 9, 1995
Sold by
Demiranda John and Casner Carol Ann
Bought by
Sabala Tony R and Ramirez Asuncion
Home Financials for this Owner
Home Financials are based on the most recent Mortgage that was taken out on this home.
Original Mortgage
$77,686
Interest Rate
7.42%
Mortgage Type
FHA
Purchase Details
Closed on
Dec 28, 1993
Sold by
Demiranda John and Casner Carol Ann
Bought by
Demiranda Josephine
Create a Home Valuation Report for This Property
The Home Valuation Report is an in-depth analysis detailing your home's value as well as a comparison with similar homes in the area
Home Values in the Area
Average Home Value in this Area
Purchase History
| Date | Buyer | Sale Price | Title Company |
|---|---|---|---|
| Sabala Tony R | -- | Alliance Title Company | |
| Sabala Tony R | $78,000 | Stewart Title | |
| Demiranda Josephine | -- | -- | |
| Demiranda John | -- | -- |
Source: Public Records
Mortgage History
| Date | Status | Borrower | Loan Amount |
|---|---|---|---|
| Open | Sabala Tony R | $97,000 | |
| Closed | Sabala Tony R | $77,686 |
Source: Public Records
Tax History Compared to Growth
Tax History
| Year | Tax Paid | Tax Assessment Tax Assessment Total Assessment is a certain percentage of the fair market value that is determined by local assessors to be the total taxable value of land and additions on the property. | Land | Improvement |
|---|---|---|---|---|
| 2025 | $1,849 | $129,546 | $49,820 | $79,726 |
| 2024 | $1,849 | $127,007 | $48,844 | $78,163 |
| 2023 | $1,756 | $124,518 | $47,887 | $76,631 |
| 2022 | $1,727 | $122,078 | $46,949 | $75,129 |
| 2021 | $1,731 | $119,685 | $46,029 | $73,656 |
| 2020 | $1,727 | $118,459 | $45,558 | $72,901 |
| 2019 | $1,701 | $116,137 | $44,665 | $71,472 |
| 2018 | $1,641 | $113,861 | $43,790 | $70,071 |
| 2017 | $1,603 | $111,630 | $42,932 | $68,698 |
| 2016 | $1,553 | $109,442 | $42,091 | $67,351 |
| 2015 | $1,512 | $107,799 | $41,459 | $66,340 |
| 2014 | $1,437 | $105,688 | $40,647 | $65,041 |
Source: Public Records
Map
Nearby Homes
- 30 Cedro Cir
- 2897 Candido Dr
- 2872 Baronet Way
- 1763 Bridgecreek Dr
- 1738 Bannon Creek Dr
- 42 Timberwood Ct
- 34 Timberwood Ct
- 14 Blue Heron Ct
- 34 Prestwick Ct
- 2580 W El Camino Ave Unit 11103
- 350 Del Verde Cir Unit 6
- 600 Del Verde Cir Unit 2
- 100 Del Verde Cir Unit 4
- 2866 Roseau Way
- 15 Hoy Lake Ct
- 26 Rosier Cir
- 750 Del Verde Cir Unit 6
- 3127 Mill Oak Way
- 2554 Burnaby Way
- 800 Del Verde Cir Unit 6
- 2860 Azevedo Dr
- 2090 Delgado Way
- 2101 Delgado Way
- 2850 Azevedo Dr
- 2080 Delgado Way
- 2884 Azevedo Dr
- 2095 Delgado Way
- 2049 Las Coches Way
- 2055 Las Coches Way
- 2085 Delgado Way
- 2804 Aquino Dr
- 2875 Azevedo Dr
- 2888 Azevedo Dr
- 2879 Azevedo Dr
- 2043 Las Coches Way
- 2070 Delgado Way
- 2803 Aquino Dr
- 2883 Azevedo Dr
- 2081 Delgado Way
- 2855 Azevedo Dr