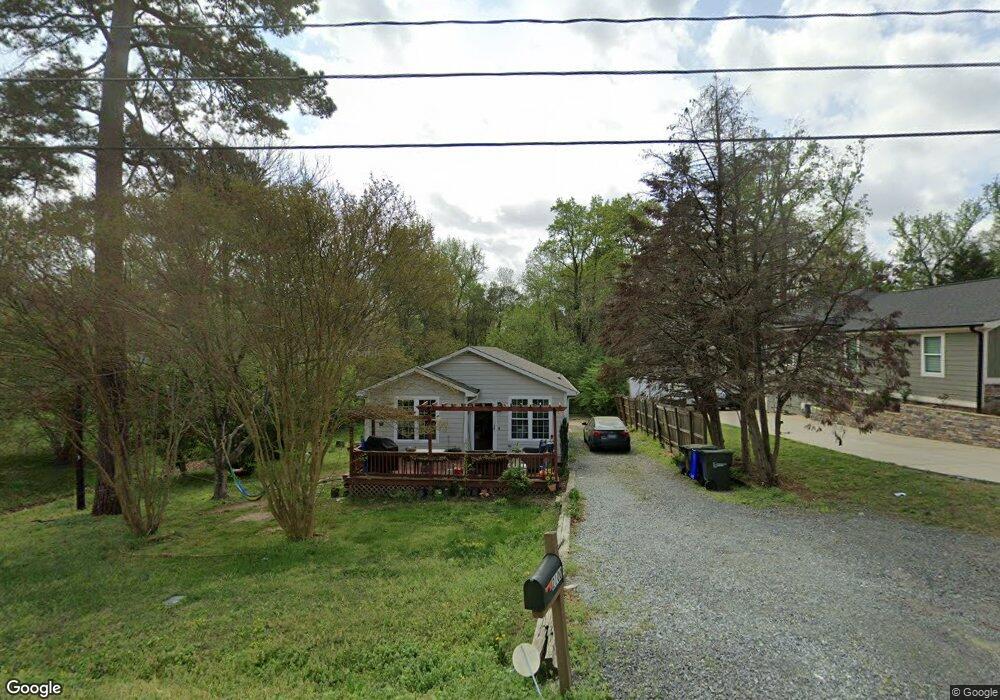
2100 Faucette Ave Durham, NC 27704
Northeast Durham NeighborhoodEstimated Value: $243,000 - $285,000
3
Beds
2
Baths
1,000
Sq Ft
$257/Sq Ft
Est. Value
About This Home
This home is located at 2100 Faucette Ave, Durham, NC 27704 and is currently estimated at $257,449, approximately $257 per square foot. 2100 Faucette Ave is a home located in Durham County with nearby schools including Merrick-Moore Elementary School, John W Neal Middle School, and Southern School of Energy & Sustainability.
Ownership History
Date
Name
Owned For
Owner Type
Purchase Details
Closed on
Mar 29, 2019
Sold by
Carlon Hugo Huber Gonzalez and Tecalco Araceli Renteral
Bought by
Buezo Oscar Abennabeth Morales
Current Estimated Value
Home Financials for this Owner
Home Financials are based on the most recent Mortgage that was taken out on this home.
Original Mortgage
$161,405
Outstanding Balance
$141,904
Interest Rate
4.3%
Mortgage Type
New Conventional
Estimated Equity
$115,545
Purchase Details
Closed on
Sep 12, 2018
Sold by
Fannie Mae
Bought by
Gonzalez Carlon Hugo Huber
Purchase Details
Closed on
Jul 25, 1999
Sold by
Darrell Wright
Bought by
Hayes Ethel Mae
Home Financials for this Owner
Home Financials are based on the most recent Mortgage that was taken out on this home.
Original Mortgage
$71,200
Interest Rate
7.66%
Create a Home Valuation Report for This Property
The Home Valuation Report is an in-depth analysis detailing your home's value as well as a comparison with similar homes in the area
Home Values in the Area
Average Home Value in this Area
Purchase History
| Date | Buyer | Sale Price | Title Company |
|---|---|---|---|
| Buezo Oscar Abennabeth Morales | $170,000 | None Available | |
| Gonzalez Carlon Hugo Huber | -- | None Available | |
| Hayes Ethel Mae | $89,000 | -- |
Source: Public Records
Mortgage History
| Date | Status | Borrower | Loan Amount |
|---|---|---|---|
| Open | Buezo Oscar Abennabeth Morales | $161,405 | |
| Previous Owner | Hayes Ethel Mae | $71,200 | |
| Closed | Hayes Ethel Mae | $17,800 |
Source: Public Records
Tax History Compared to Growth
Tax History
| Year | Tax Paid | Tax Assessment Tax Assessment Total Assessment is a certain percentage of the fair market value that is determined by local assessors to be the total taxable value of land and additions on the property. | Land | Improvement |
|---|---|---|---|---|
| 2025 | $1,987 | $274,249 | $78,750 | $195,499 |
| 2024 | $1,987 | $142,459 | $25,140 | $117,319 |
| 2023 | $1,866 | $142,459 | $25,140 | $117,319 |
| 2022 | $1,823 | $142,459 | $25,140 | $117,319 |
| 2021 | $1,815 | $142,459 | $25,140 | $117,319 |
| 2020 | $1,772 | $142,459 | $25,140 | $117,319 |
| 2019 | $1,772 | $142,459 | $25,140 | $117,319 |
| 2018 | $1,118 | $82,427 | $21,997 | $60,430 |
| 2017 | $1,110 | $82,427 | $21,997 | $60,430 |
| 2016 | $1,072 | $82,427 | $21,997 | $60,430 |
| 2015 | $1,380 | $99,705 | $24,367 | $75,338 |
| 2014 | $1,380 | $99,705 | $24,367 | $75,338 |
Source: Public Records
Map
Nearby Homes
- 1113 Midland Terrace
- 2015 Cheek Rd
- 2321 Overland Dr
- 2125 Cheek Rd
- 5 Sue Ann Ct
- 1823 E Geer St
- 1821 E Geer St
- 1519 Milan St
- 18 Syracuse Place
- 647 N Hardee St
- 1515 Milan St
- 1115 Benning St
- 1509 Logan St
- 1124 E Geer St
- 713 Heidelberg St
- 2003 Rabbitbrush St
- 2013 Rabbitbrush St
- 2009 Rabbitbrush St
- 2214 Rabbitbrush St
- 2204 Rabbitbrush St
- 2104 Faucette Ave
- 2008 Faucette Ave
- 2106 Faucette Ave
- 2006 Faucette Ave
- 2108 Faucette Ave
- 2004 Faucette Ave
- 2112 Faucette Ave
- 2105 Faucette Ave
- 2002 Faucette Ave
- 2103 Faucette Ave
- 2007 Faucette Ave
- 2109 Faucette Ave
- 2111 Aiken Ave
- 2114 Faucette Ave
- 2113 Aiken Ave
- 2003 Faucette Ave
- 2000 Faucette Ave
- 2115 Aiken Ave
- 2111 Faucette Ave
- 2107 Aiken Ave