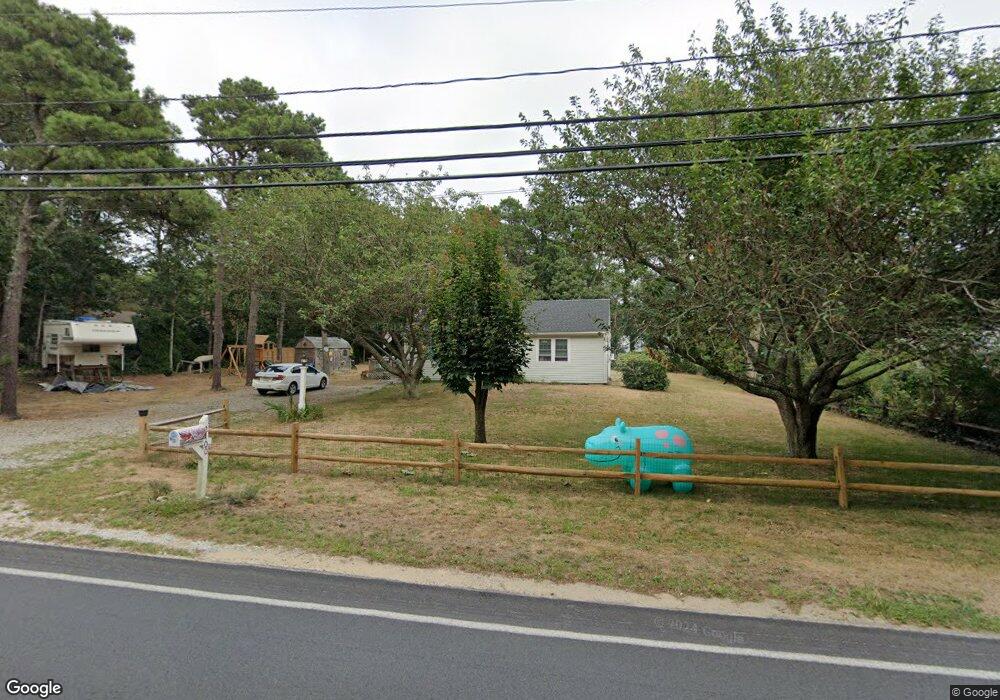
2100 Herring Brook Rd Eastham, MA 02642
Estimated Value: $562,219 - $662,000
2
Beds
1
Bath
864
Sq Ft
$718/Sq Ft
Est. Value
About This Home
This home is located at 2100 Herring Brook Rd, Eastham, MA 02642 and is currently estimated at $620,055, approximately $717 per square foot. 2100 Herring Brook Rd is a home located in Barnstable County with nearby schools including Eastham Elementary School, Nauset Regional Middle School, and Nauset Regional High School.
Ownership History
Date
Name
Owned For
Owner Type
Purchase Details
Closed on
Jan 4, 2021
Sold by
Rm Creative Home Inc
Bought by
Kreber Sabrina E and Kreber Kathy A
Current Estimated Value
Home Financials for this Owner
Home Financials are based on the most recent Mortgage that was taken out on this home.
Original Mortgage
$382,500
Outstanding Balance
$341,323
Interest Rate
2.7%
Mortgage Type
Purchase Money Mortgage
Estimated Equity
$278,732
Purchase Details
Closed on
Sep 9, 2020
Sold by
Bedard Nancy E Est
Bought by
Rm Creative Homes Inc
Home Financials for this Owner
Home Financials are based on the most recent Mortgage that was taken out on this home.
Original Mortgage
$340,000
Interest Rate
2.9%
Mortgage Type
New Conventional
Purchase Details
Closed on
Nov 12, 1986
Bought by
Bedard Nancy E
Create a Home Valuation Report for This Property
The Home Valuation Report is an in-depth analysis detailing your home's value as well as a comparison with similar homes in the area
Home Values in the Area
Average Home Value in this Area
Purchase History
| Date | Buyer | Sale Price | Title Company |
|---|---|---|---|
| Kreber Sabrina E | $425,000 | None Available | |
| Rm Creative Homes Inc | $285,000 | None Available | |
| Bedard Nancy E | -- | -- |
Source: Public Records
Mortgage History
| Date | Status | Borrower | Loan Amount |
|---|---|---|---|
| Open | Kreber Sabrina E | $382,500 | |
| Previous Owner | Rm Creative Homes Inc | $340,000 | |
| Previous Owner | Bedard Nancy E | $417,000 | |
| Previous Owner | Bedard Nancy E | $13,420 | |
| Previous Owner | Bedard Nancy E | $37,000 |
Source: Public Records
Tax History
| Year | Tax Paid | Tax Assessment Tax Assessment Total Assessment is a certain percentage of the fair market value that is determined by local assessors to be the total taxable value of land and additions on the property. | Land | Improvement |
|---|---|---|---|---|
| 2025 | $3,609 | $468,100 | $250,600 | $217,500 |
| 2024 | $3,016 | $430,200 | $219,000 | $211,200 |
| 2023 | $2,801 | $386,900 | $202,800 | $184,100 |
| 2022 | $2,687 | $313,200 | $181,000 | $132,200 |
| 2021 | $2,525 | $275,000 | $164,500 | $110,500 |
| 2020 | $2,367 | $271,400 | $167,900 | $103,500 |
| 2019 | $2,176 | $263,700 | $163,100 | $100,600 |
| 2018 | $2,138 | $256,000 | $158,300 | $97,700 |
| 2017 | $1,983 | $251,000 | $155,200 | $95,800 |
| 2016 | $1,983 | $266,500 | $172,400 | $94,100 |
| 2015 | $1,850 | $260,500 | $169,100 | $91,400 |
Source: Public Records
Map
Nearby Homes
- 600 Kingsbury Beach Rd
- 10 Field Rd
- 255 Massasoit Rd
- 85 Huckleberry Ln
- 82 Old Orchard Rd
- 3098 State Hwy
- 20 Oak Rd
- 35 Wiley Ln
- 21 Locust Rd Unit 21
- 50 Surrey Dr
- 65 Cestaro Way
- 655 Herring Brook Rd
- 190 Silver Spring Beach Rd
- 495 Aspinet Rd
- 18 Jay Dee Ln
- 20 Stone Ct
- 80 Quason Dr
- 115 Wamsutta Rd
- 255 Epanow Rd
- 1975 State Hwy Unit 9
- 5 Weir Rd
- 10 Captain Michaels Rd
- 15 Weir Rd
- 15 Capt Michaels Rd
- 30 Captain Michaels Rd
- 2115 Herring Brook Rd
- 15 Captain Michaels Rd
- 2060 Herring Brook Rd
- 20 Weir Rd
- 40 Captain Michaels Rd
- 35 Weir Rd
- 2075 Herring Brook Rd
- 175 Shady Ln
- 45 Captain Michaels Rd
- 20 Maria Rd
- 190 Shady Ln
- 25 Maria Rd
- 10 Windy Bay Rd
- 2050 Herring Brook Rd
- 15 Thumpertown Rd
Your Personal Tour Guide
Ask me questions while you tour the home.