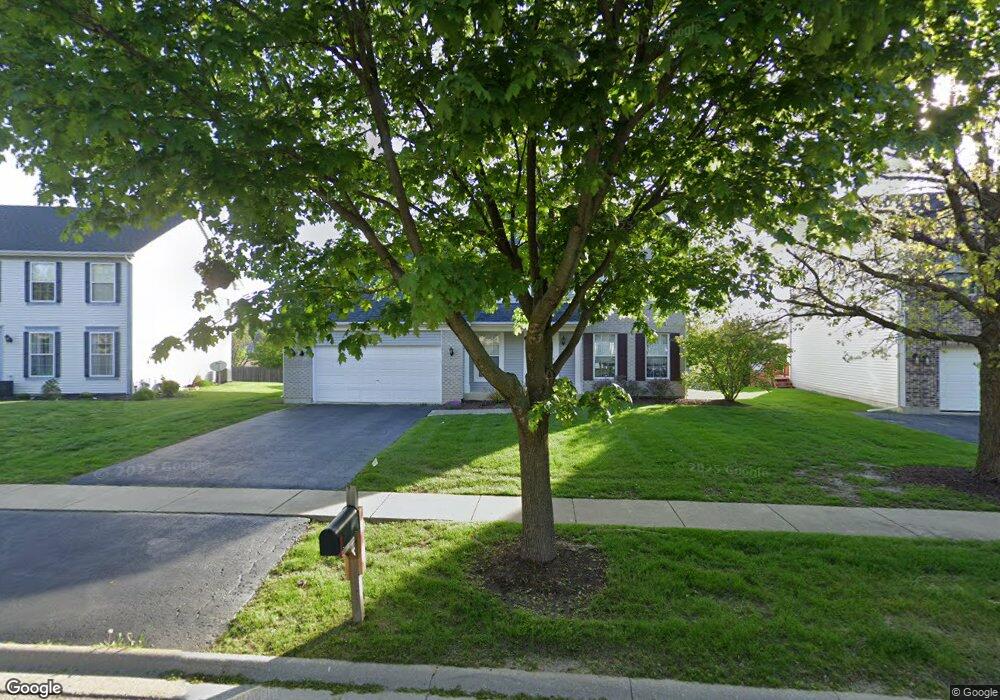
2100 Langdon Cir Plainfield, IL 60586
North Minooka NeighborhoodEstimated Value: $369,163 - $403,000
Studio
1
Bath
1,893
Sq Ft
$205/Sq Ft
Est. Value
About This Home
This home is located at 2100 Langdon Cir, Plainfield, IL 60586 and is currently estimated at $387,388, approximately $204 per square foot. 2100 Langdon Cir is a home located in Kendall County with nearby schools including Charles Reed Elementary School, Drauden Point Middle School, and Plainfield South High School.
Ownership History
Date
Name
Owned For
Owner Type
Purchase Details
Closed on
Jul 9, 2024
Sold by
Nielsen Peter S
Bought by
Peter Nielsen Trust and Nielsen
Current Estimated Value
Purchase Details
Closed on
May 1, 2013
Sold by
Nielson Plier S and Nielson Cynthia K
Bought by
Nielson Peter S
Home Financials for this Owner
Home Financials are based on the most recent Mortgage that was taken out on this home.
Original Mortgage
$144,000
Interest Rate
3.39%
Mortgage Type
New Conventional
Purchase Details
Closed on
Sep 9, 1997
Sold by
Richard Smykal Inc
Bought by
Nielsen Peter S and Nielsen Cynthia K
Home Financials for this Owner
Home Financials are based on the most recent Mortgage that was taken out on this home.
Original Mortgage
$156,350
Interest Rate
7.63%
Create a Home Valuation Report for This Property
The Home Valuation Report is an in-depth analysis detailing your home's value as well as a comparison with similar homes in the area
Home Values in the Area
Average Home Value in this Area
Purchase History
| Date | Buyer | Sale Price | Title Company |
|---|---|---|---|
| Peter Nielsen Trust | -- | None Listed On Document | |
| Nielson Peter S | -- | None Available | |
| Nielsen Peter S | $171,500 | Chicago Title Insurance Co |
Source: Public Records
Mortgage History
| Date | Status | Borrower | Loan Amount |
|---|---|---|---|
| Previous Owner | Nielson Peter S | $144,000 | |
| Previous Owner | Nielsen Peter S | $156,350 |
Source: Public Records
Tax History
| Year | Tax Paid | Tax Assessment Tax Assessment Total Assessment is a certain percentage of the fair market value that is determined by local assessors to be the total taxable value of land and additions on the property. | Land | Improvement |
|---|---|---|---|---|
| 2024 | $7,974 | $116,270 | $15,008 | $101,262 |
| 2023 | $6,713 | $101,302 | $14,000 | $87,302 |
| 2022 | $6,713 | $90,303 | $13,860 | $76,443 |
| 2021 | $6,615 | $87,276 | $14,071 | $73,205 |
| 2020 | $6,491 | $84,258 | $14,451 | $69,807 |
| 2019 | $6,266 | $80,269 | $13,767 | $66,502 |
| 2018 | $6,372 | $80,269 | $13,767 | $66,502 |
| 2017 | $6,305 | $75,955 | $13,027 | $62,928 |
| 2016 | $5,954 | $70,488 | $12,866 | $57,622 |
| 2015 | $5,994 | $67,732 | $12,210 | $55,522 |
| 2014 | -- | $60,353 | $12,210 | $48,143 |
| 2013 | -- | $60,353 | $12,210 | $48,143 |
Source: Public Records
Map
Nearby Homes
- 2126 Ingersoll Ct
- 2031 Havenhill Dr
- 2017 Lilyana Ln
- 7013 Manchester Dr
- 7202 Faxton Ln
- 2009 Ashbrook Ct Unit 3
- 2302 Covington Ct
- 2224 Ashby Ln
- 7311 Fordham Ln
- 1811 Cumberland Dr
- 1702 Waterman Dr
- 6709 Buchanan Cir
- 6710 Buchanan Cir
- 6707 Buchanan Cir
- 6708 Buchanan Cir
- 1812 Overland Dr
- 1800 Overland Dr
- 1803 Overland Dr
- 1802 Overland Dr
- 1801 Overland Dr
- 2018 Langdon Cir Unit 6
- 2102 Langdon Cir
- 2113 Ingersoll Ct
- 2115 Ingersoll Ct
- 2104 Langdon Cir
- 2016 Langdon Cir
- 2111 Ingersoll Ct
- 2117 Ingersoll Ct
- 2019 Langdon Cir
- 2017 Langdon Cir
- 2119 Ingersoll Ct
- 2103 Langdon Cir
- 2106 Langdon Cir
- 2109 Ingersoll Ct
- 2121 Ingersoll Ct Unit 2121
- 2014 Langdon Cir
- 2123 Ingersoll Ct
- 2015 Langdon Cir Unit 1
- 2105 Langdon Cir
- 2107 Ingersoll Ct
Your Personal Tour Guide
Ask me questions while you tour the home.