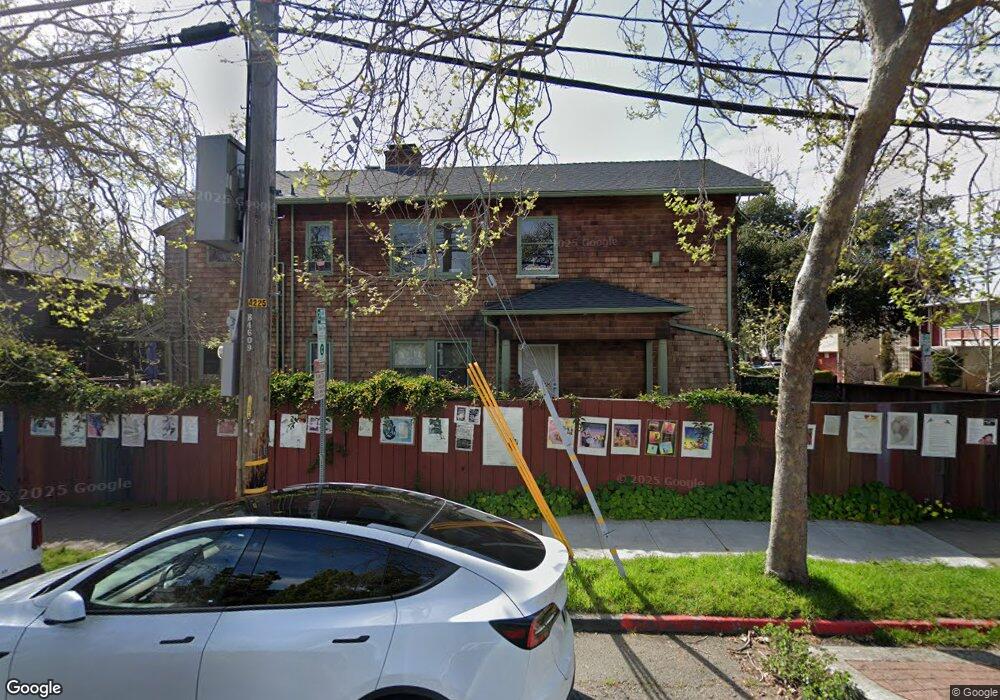
2100 Mckinley Ave Berkeley, CA 94703
Downtown Berkeley NeighborhoodEstimated Value: $1,085,000 - $1,558,000
3
Beds
3
Baths
2,382
Sq Ft
$547/Sq Ft
Est. Value
About This Home
This home is located at 2100 Mckinley Ave, Berkeley, CA 94703 and is currently estimated at $1,304,000, approximately $547 per square foot. 2100 Mckinley Ave is a home located in Alameda County with nearby schools including Washington Elementary School, Berkeley Arts Magnet at Whittier School, and Oxford Elementary School.
Ownership History
Date
Name
Owned For
Owner Type
Purchase Details
Closed on
Mar 25, 2021
Sold by
Green Deborah
Bought by
Green Deborah and Deborah Green Revocable Living
Current Estimated Value
Purchase Details
Closed on
Jun 9, 2017
Sold by
Green Deborah
Bought by
Green Deborah
Home Financials for this Owner
Home Financials are based on the most recent Mortgage that was taken out on this home.
Original Mortgage
$150,656
Outstanding Balance
$79,047
Interest Rate
4.02%
Mortgage Type
New Conventional
Estimated Equity
$1,224,953
Purchase Details
Closed on
Jun 30, 1999
Sold by
Minkler Douglas
Bought by
Green Deborah
Home Financials for this Owner
Home Financials are based on the most recent Mortgage that was taken out on this home.
Original Mortgage
$196,000
Interest Rate
7.25%
Purchase Details
Closed on
Oct 13, 1993
Sold by
Green Rose M
Bought by
Green Deborah Diane
Create a Home Valuation Report for This Property
The Home Valuation Report is an in-depth analysis detailing your home's value as well as a comparison with similar homes in the area
Home Values in the Area
Average Home Value in this Area
Purchase History
| Date | Buyer | Sale Price | Title Company |
|---|---|---|---|
| Green Deborah | -- | None Available | |
| Green Deborah | -- | None Available | |
| Green Deborah | -- | Nortwestern Title Company | |
| Green Deborah Diane | -- | -- |
Source: Public Records
Mortgage History
| Date | Status | Borrower | Loan Amount |
|---|---|---|---|
| Open | Green Deborah | $150,656 | |
| Closed | Green Deborah | $196,000 |
Source: Public Records
Tax History
| Year | Tax Paid | Tax Assessment Tax Assessment Total Assessment is a certain percentage of the fair market value that is determined by local assessors to be the total taxable value of land and additions on the property. | Land | Improvement |
|---|---|---|---|---|
| 2025 | $8,960 | $400,202 | $121,973 | $285,229 |
| 2024 | $8,960 | $392,218 | $119,581 | $279,637 |
| 2023 | $8,744 | $391,391 | $117,237 | $274,154 |
| 2022 | $8,520 | $376,718 | $114,938 | $268,780 |
| 2021 | $8,492 | $369,195 | $112,685 | $263,510 |
| 2020 | $7,876 | $372,339 | $111,530 | $260,809 |
| 2019 | $7,388 | $365,038 | $109,343 | $255,695 |
| 2018 | $7,225 | $357,881 | $107,199 | $250,682 |
| 2017 | $6,943 | $350,866 | $105,098 | $245,768 |
| 2016 | $6,602 | $343,988 | $103,038 | $240,950 |
| 2015 | $6,497 | $338,821 | $101,490 | $237,331 |
| 2014 | $6,583 | $332,185 | $99,502 | $232,683 |
Source: Public Records
Map
Nearby Homes
- 2218 -2222 Grant St
- 2118 California St
- 2015 Delaware St
- 2015 Delaware St Unit A
- 1813 Sacramento St
- 1625 Martin Luther King jr Way
- 1808 Cedar St
- 1436 Delaware St
- 1645 Dwight Way
- 1609 Bonita Ave Unit 5
- 1610 Milvia St
- 1411 Hearst Ave Unit 2
- 2350 Sacramento St
- 1901 Parker St Unit 3
- 2018 Blake St
- 1682 Oxford St
- 2201 Virginia St Unit 2
- 1739 Spruce St
- 1815 Vine St
- 1564 Sacramento St
- 2110 Mckinley Ave
- 1810 Addison St
- 2112 Mckinley Ave Unit D
- 2112 Mckinley Ave Unit C
- 2112 Mckinley Ave Unit B
- 2112 Mckinley Ave Unit A
- 1808 Addison St
- 1806 Addison St
- 2114 Mckinley Ave
- 1821 Addison St
- 1815 Addison St
- 1825 Addison St
- 2111 Grant St
- 2118 Mckinley Ave
- 2107 Grant St
- 2115 Grant St
- 1807 Addison St
- 1827 Addison St
- 2021 Grant St
- 2117 Grant St
Your Personal Tour Guide
Ask me questions while you tour the home.