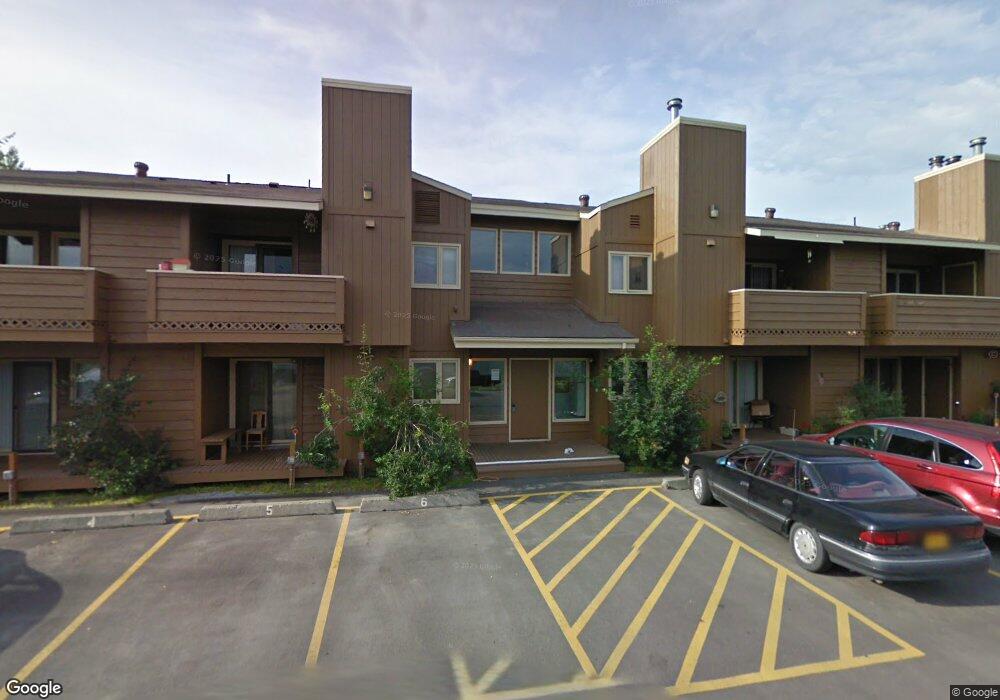
2100 Minerva Way Unit A12 Anchorage, AK 99515
Bayshore-Klatt NeighborhoodEstimated Value: $141,847 - $241,000
2
Beds
1
Bath
605
Sq Ft
$294/Sq Ft
Est. Value
About This Home
This home is located at 2100 Minerva Way Unit A12, Anchorage, AK 99515 and is currently estimated at $177,616, approximately $293 per square foot. 2100 Minerva Way Unit A12 is a home located in Anchorage Municipality with nearby schools including Bayshore Elementary School, Mears Middle School, and Dimond High School.
Ownership History
Date
Name
Owned For
Owner Type
Purchase Details
Closed on
Dec 21, 2007
Sold by
Ekamrak Carl K and Ekamrak Joyce
Bought by
Medley Taylor E
Current Estimated Value
Home Financials for this Owner
Home Financials are based on the most recent Mortgage that was taken out on this home.
Original Mortgage
$78,592
Outstanding Balance
$49,262
Interest Rate
6.2%
Estimated Equity
$128,354
Purchase Details
Closed on
Nov 19, 2002
Sold by
Equity Investors Inc
Bought by
Ekamrak Clark K and Ekamrak Joyce
Home Financials for this Owner
Home Financials are based on the most recent Mortgage that was taken out on this home.
Original Mortgage
$67,050
Interest Rate
5.89%
Mortgage Type
Purchase Money Mortgage
Purchase Details
Closed on
Nov 18, 2002
Sold by
Equity Investors Inc
Bought by
Ekamrak Clark K and Ekamrak Joyce
Home Financials for this Owner
Home Financials are based on the most recent Mortgage that was taken out on this home.
Original Mortgage
$67,050
Interest Rate
5.89%
Mortgage Type
Purchase Money Mortgage
Purchase Details
Closed on
Nov 14, 2002
Sold by
Medina Alberto and Medina Maria Betty
Bought by
Equity Investors Inc
Home Financials for this Owner
Home Financials are based on the most recent Mortgage that was taken out on this home.
Original Mortgage
$67,050
Interest Rate
5.89%
Mortgage Type
Purchase Money Mortgage
Create a Home Valuation Report for This Property
The Home Valuation Report is an in-depth analysis detailing your home's value as well as a comparison with similar homes in the area
Home Values in the Area
Average Home Value in this Area
Purchase History
| Date | Buyer | Sale Price | Title Company |
|---|---|---|---|
| Medley Taylor E | -- | None Available | |
| Ekamrak Clark K | -- | -- | |
| Ekamrak Clark K | -- | -- | |
| Equity Investors Inc | $2,501 | -- |
Source: Public Records
Mortgage History
| Date | Status | Borrower | Loan Amount |
|---|---|---|---|
| Open | Medley Taylor E | $78,592 | |
| Previous Owner | Ekamrak Clark K | $67,050 | |
| Previous Owner | Ekamrak Clark K | $67,050 | |
| Previous Owner | Equity Investors Inc | $67,050 |
Source: Public Records
Tax History Compared to Growth
Tax History
| Year | Tax Paid | Tax Assessment Tax Assessment Total Assessment is a certain percentage of the fair market value that is determined by local assessors to be the total taxable value of land and additions on the property. | Land | Improvement |
|---|---|---|---|---|
| 2025 | $1,719 | $140,700 | -- | $140,700 |
| 2024 | $1,719 | $106,500 | $0 | $106,500 |
| 2023 | $1,689 | $99,200 | $0 | $99,200 |
| 2022 | $1,684 | $100,000 | $0 | $100,000 |
| 2021 | $1,854 | $102,900 | $0 | $102,900 |
| 2020 | $1,899 | $111,700 | $0 | $111,700 |
| 2019 | $1,605 | $98,100 | $0 | $98,100 |
| 2018 | $1,551 | $94,600 | $0 | $94,600 |
| 2017 | $1,640 | $104,700 | $0 | $104,700 |
| 2016 | $1,310 | $102,500 | $0 | $102,500 |
| 2015 | $1,310 | $98,100 | $0 | $98,100 |
| 2014 | $1,310 | $90,000 | $0 | $90,000 |
Source: Public Records
Map
Nearby Homes
- 2105 Minerva Way Unit 2105
- 2100 Minerva Way Unit A17
- 2059 Stonegate Cir
- 9665 Victor Rd Unit 7B
- 2542 Curlew Cir Unit 5
- 9520 Albatross Dr
- 1655 Ira Dr
- 000 Emerald Hills
- 9162 Aphrodite Dr
- L14-18 Laurel Acres
- 8930 Arlene St
- 8920 Arlene St
- 2923 Kingfisher Dr
- 9630 Arlene Dr
- 2320 Tasha Dr
- L6 B8 Spartan Dr
- L5 B8 Spartan Dr
- 2301 Harbor Landing Cir
- 8611 Flamingo Dr
- 1767 W Dimond Blvd
- 2100 Minerva Way
- 2100 Minerva Way
- 2100 Minerva Way
- 2100 Minerva Way
- 2100 Minerva Way Unit A2
- 2100 Minerva Way Unit A-05
- 2100 Minerva Way Unit 20A
- 2100 Minerva Way Unit 12A
- 2100 Minerva Way Unit 11A
- 2100 Minerva Way Unit 9
- 2100 Minerva Way Unit 1
- 2100 Minerva Way Unit A13
- 2100 Minerva Way Unit A-06
- 2100 Minerva Way Unit A20
- 2100 Minerva Way Unit 8
- 2100 Minerva Way Unit A19
- 2100 Minerva Way Unit A-04
- 2100 Minerva Way Unit A22
- 2100 Minerva Way Unit A5
- 2100 Minerva Way Unit A14