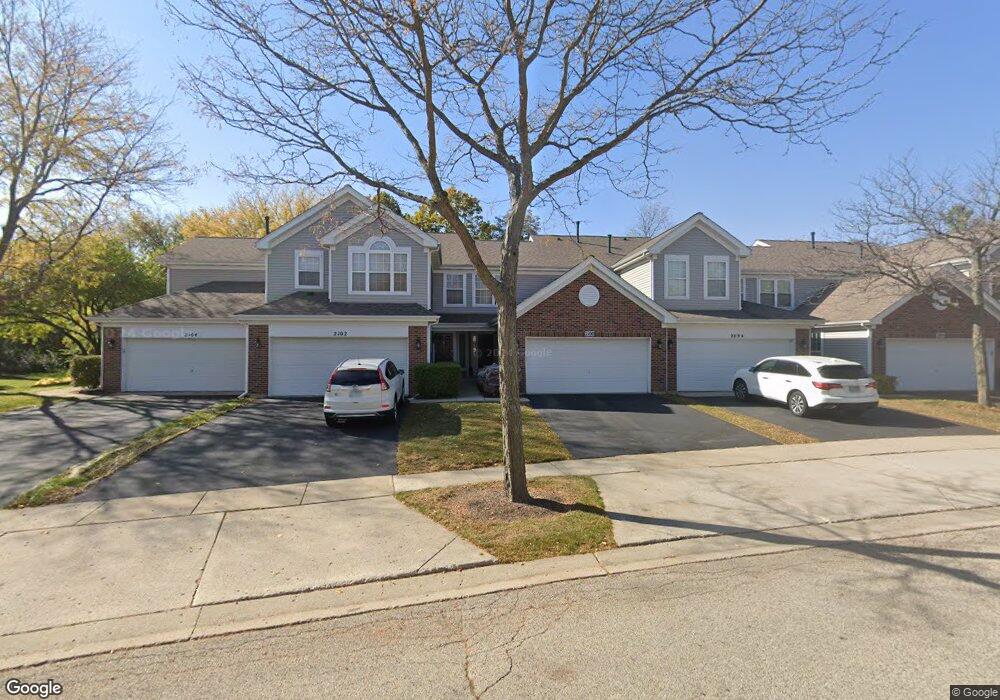
2100 Peach Tree Ln Unit 4233 Algonquin, IL 60102
Estimated Value: $265,503 - $292,000
2
Beds
--
Bath
1,332
Sq Ft
$211/Sq Ft
Est. Value
About This Home
This home is located at 2100 Peach Tree Ln Unit 4233, Algonquin, IL 60102 and is currently estimated at $281,376, approximately $211 per square foot. 2100 Peach Tree Ln Unit 4233 is a home located in Kane County with nearby schools including Westfield Community School and Harry D Jacobs High School.
Ownership History
Date
Name
Owned For
Owner Type
Purchase Details
Closed on
Mar 20, 2011
Sold by
Flores Ramiro and Flores Ana M
Bought by
Flores Ana M
Current Estimated Value
Purchase Details
Closed on
Feb 21, 2005
Sold by
Flores Ramiro and Flores Ana M
Bought by
Perez Ana M and Flores Ramiro
Home Financials for this Owner
Home Financials are based on the most recent Mortgage that was taken out on this home.
Original Mortgage
$132,000
Outstanding Balance
$68,457
Interest Rate
6.06%
Mortgage Type
New Conventional
Estimated Equity
$212,919
Purchase Details
Closed on
May 29, 1997
Sold by
Cuttone Eugene A and Cuttone Susan G
Bought by
Flores Ramiro and Flores Ana M
Home Financials for this Owner
Home Financials are based on the most recent Mortgage that was taken out on this home.
Original Mortgage
$90,800
Interest Rate
8.27%
Purchase Details
Closed on
Jan 13, 1994
Sold by
Willoughby Farms Townhomes Ltd Prtnrshp
Bought by
Cuttone Eugene A and Cuttone Susan G
Create a Home Valuation Report for This Property
The Home Valuation Report is an in-depth analysis detailing your home's value as well as a comparison with similar homes in the area
Purchase History
| Date | Buyer | Sale Price | Title Company |
|---|---|---|---|
| Flores Ana M | -- | None Available | |
| Perez Ana M | -- | Commercial Land Title Ins Co | |
| Flores Ramiro | $113,500 | Universal Title Services Inc | |
| Cuttone Eugene A | $111,000 | Chicago Title Insurance Co |
Source: Public Records
Mortgage History
| Date | Status | Borrower | Loan Amount |
|---|---|---|---|
| Open | Perez Ana M | $132,000 | |
| Closed | Flores Ramiro | $90,800 |
Source: Public Records
Tax History
| Year | Tax Paid | Tax Assessment Tax Assessment Total Assessment is a certain percentage of the fair market value that is determined by local assessors to be the total taxable value of land and additions on the property. | Land | Improvement |
|---|---|---|---|---|
| 2024 | $5,396 | $70,966 | $8,371 | $62,595 |
| 2023 | $5,197 | $63,853 | $7,532 | $56,321 |
| 2022 | $4,793 | $57,347 | $7,532 | $49,815 |
| 2021 | $4,669 | $54,147 | $7,112 | $47,035 |
| 2020 | $4,585 | $52,930 | $6,952 | $45,978 |
| 2019 | $4,461 | $50,247 | $6,600 | $43,647 |
| 2018 | $4,097 | $44,437 | $6,469 | $37,968 |
| 2017 | $3,952 | $41,568 | $6,051 | $35,517 |
| 2016 | $4,064 | $40,248 | $5,859 | $34,389 |
| 2015 | -- | $37,714 | $5,490 | $32,224 |
| 2014 | -- | $36,672 | $5,338 | $31,334 |
| 2013 | -- | $43,788 | $5,501 | $38,287 |
Source: Public Records
Map
Nearby Homes
- 2069 Peach Tree Ln Unit 4116
- 20 Peach Tree Ct Unit 4153
- 18 Peach Tree Ct Unit 4154
- 1900 Waverly Ln
- 2051 Carlisle St
- 2612 Loren Ln Unit 293
- 1239 Glenmont St
- 1141 Glenmont St
- 1157 Sawmill Ln
- 1090 Glenmont St
- 1247 Glenmont St
- 1250 Glenmont St
- 1241 Glenmont St
- 1111 Glenmont St
- 1243 Glenmont St
- 1080 Glenmont St
- 1030 Glenmont St
- 1249 Glenmont St
- 1245 Glenmont St
- 1020 Glenmont St
- 2092 Peach Tree Ln Unit 4235
- 2102 Peach Tree Ln Unit 4232
- 2104 Peach Tree Ln Unit 4231
- 2090 Peach Tree Ln Unit 4236
- 2070 Peach Tree Ln Unit 4226
- 2120 Peach Tree Ln Unit 4241
- 2114 Peach Tree Ln Unit 4244
- 2118 Peach Tree Ln Unit 4242
- 2116 Peach Tree Ln Unit 4243
- 2112 Peach Tree Ln
- 2080 Peach Tree Ln Unit 4223
- 2082 Peach Tree Ln
- 2072 Peach Tree Ln Unit 4225
- 2074 Peach Tree Ln Unit 4222
- 2084 Peach Tree Ln Unit 4221
- 2110 Peach Tree Ln
- 2095 Peach Tree Ln Unit 4093
- 2103 Peach Tree Ln Unit 4095
- 2093 Peach Tree Ln Unit 4092
- 2105 Peach Tree Ln Unit 4096
Your Personal Tour Guide
Ask me questions while you tour the home.