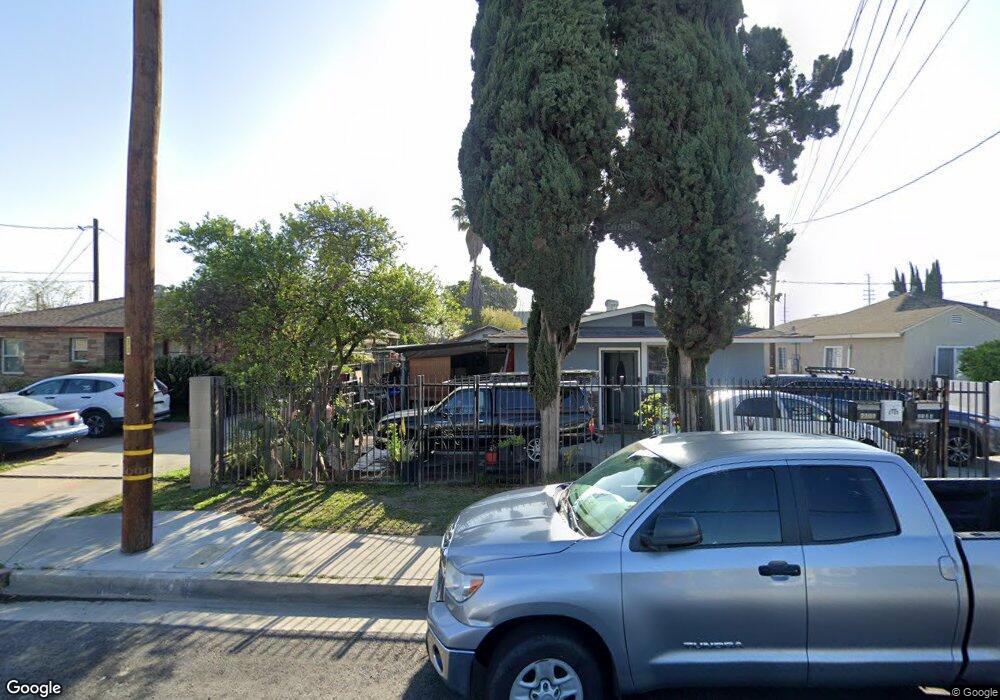
2100 Potrero Ave South El Monte, CA 91733
Estimated Value: $933,000 - $998,000
6
Beds
3
Baths
2,196
Sq Ft
$443/Sq Ft
Est. Value
About This Home
This home is located at 2100 Potrero Ave, South El Monte, CA 91733 and is currently estimated at $972,000, approximately $442 per square foot. 2100 Potrero Ave is a home located in Los Angeles County with nearby schools including Wilkerson Elementary School, South El Monte High School, and Epiphany Catholic School.
Ownership History
Date
Name
Owned For
Owner Type
Purchase Details
Closed on
Mar 17, 2024
Sold by
Herrera Jose Luis Alvarez and Dealvarez Angelica Fonseca
Bought by
Alvarez Family Revocable Living Trust and Herrera
Current Estimated Value
Purchase Details
Closed on
Jul 12, 1996
Sold by
Alvarez Jose Luis and Fonseca Irma
Bought by
Alvarez Jose Luis and Alvarez Angelica
Purchase Details
Closed on
Nov 1, 1995
Sold by
Federal National Mortgage Association
Bought by
Alvarez Jose Luis and Fonseca Irma
Home Financials for this Owner
Home Financials are based on the most recent Mortgage that was taken out on this home.
Original Mortgage
$145,700
Interest Rate
7.42%
Purchase Details
Closed on
Mar 3, 1995
Sold by
Home Svgs Of America Fsb
Bought by
Federal National Mortgage Association
Purchase Details
Closed on
Jan 26, 1995
Sold by
Pino Alejandrino and Pino Teresa
Bought by
Home Svgs Of America Fsb
Create a Home Valuation Report for This Property
The Home Valuation Report is an in-depth analysis detailing your home's value as well as a comparison with similar homes in the area
Home Values in the Area
Average Home Value in this Area
Purchase History
| Date | Buyer | Sale Price | Title Company |
|---|---|---|---|
| Alvarez Family Revocable Living Trust | -- | None Listed On Document | |
| Alvarez Jose Luis | -- | -- | |
| Alvarez Jose Luis | $150,500 | Orange Coast Title | |
| Federal National Mortgage Association | -- | -- | |
| Home Svgs Of America Fsb | $237,178 | Investors Title |
Source: Public Records
Mortgage History
| Date | Status | Borrower | Loan Amount |
|---|---|---|---|
| Previous Owner | Alvarez Jose Luis | $145,700 |
Source: Public Records
Tax History Compared to Growth
Tax History
| Year | Tax Paid | Tax Assessment Tax Assessment Total Assessment is a certain percentage of the fair market value that is determined by local assessors to be the total taxable value of land and additions on the property. | Land | Improvement |
|---|---|---|---|---|
| 2025 | $4,871 | $328,805 | $166,113 | $162,692 |
| 2024 | $4,871 | $322,358 | $162,856 | $159,502 |
| 2023 | $4,678 | $316,038 | $159,663 | $156,375 |
| 2022 | $4,677 | $309,842 | $156,533 | $153,309 |
| 2021 | $4,574 | $303,767 | $153,464 | $150,303 |
| 2020 | $4,562 | $300,653 | $151,891 | $148,762 |
| 2019 | $4,662 | $294,759 | $148,913 | $145,846 |
| 2018 | $4,438 | $288,981 | $145,994 | $142,987 |
| 2016 | $4,246 | $277,762 | $140,326 | $137,436 |
| 2015 | $4,198 | $273,591 | $138,219 | $135,372 |
| 2014 | $4,055 | $268,233 | $135,512 | $132,721 |
Source: Public Records
Map
Nearby Homes
- 2458 Tamora Ave
- 2546 Potrero Ave
- 10146 Alpaca St
- 1517 Merced Ave Unit 52
- 1517 Merced Ave Unit 43
- 1517 Merced Ave Unit 56
- 2550 Hepburn St
- 2544 Dorris St
- 2543 Dorris St
- 9404 Presley St
- 9415 Paramount St
- 9417 Paramount St
- 9401 Presley St
- 4003 Valley Oak Ln Unit B
- 4003 Valley Oak Ln Unit C
- 4003 Valley Oak Ln Unit D
- 4001 Valley Oak Ln Unit D
- 4001 Valley Oak Ln Unit C
- 4003 Valley Oak Ln Unit E
- 4003 Valley Oak Ln Unit F
- 2026 Potrero Ave
- 2108 Potrero Ave
- 2018 Potrero Ave
- 2116 Potrero Ave
- 9759 Enloe St
- 2027 Sastre Ave
- 2109 Sastre Ave
- 2104 Potrero Ave
- 2015 Potrero Ave
- 2124 Potrero Ave
- 2019 Sastre Ave
- 2115 Sastre Ave
- 9755 Enloe St
- 9754 Enloe St
- 2128 Potrero Ave
- 2125 Sastre Ave
- 9751 Enloe St
- 9823 Rush St
- 2119 Potrero Ave
- 2113 Sastre Ave