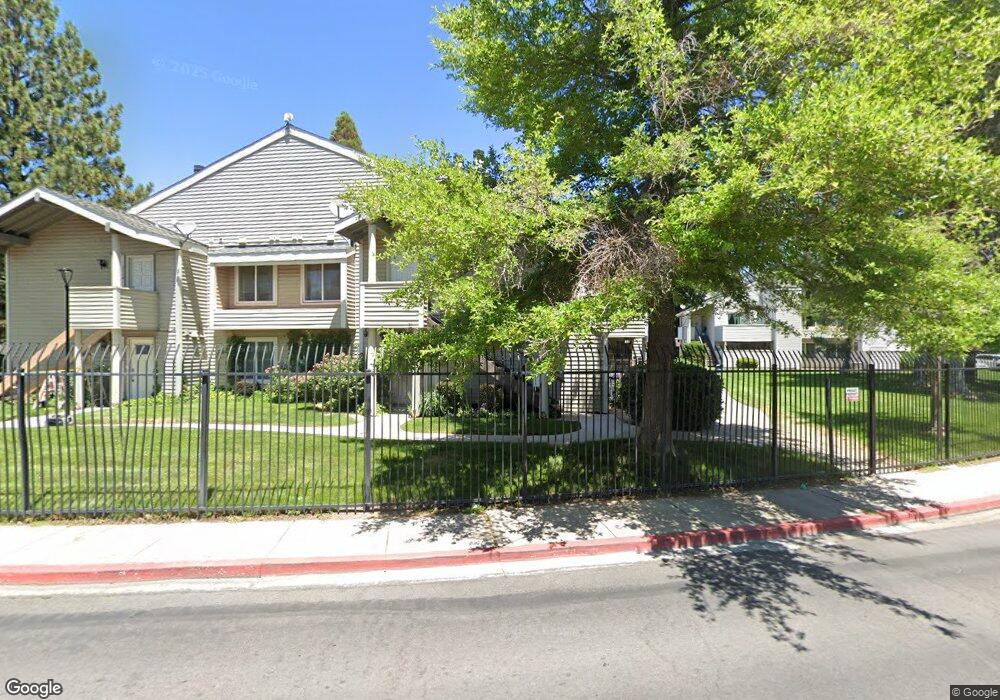
2100 Roundhouse Rd Unit 4 Sparks, NV 89431
Downtown Sparks NeighborhoodEstimated Value: $169,000 - $332,000
1
Bed
1
Bath
765
Sq Ft
$288/Sq Ft
Est. Value
About This Home
This home is located at 2100 Roundhouse Rd Unit 4, Sparks, NV 89431 and is currently estimated at $220,364, approximately $288 per square foot. 2100 Roundhouse Rd Unit 4 is a home located in Washoe County with nearby schools including Kate M Smith Elementary School, Sparks Middle School, and Sparks High School.
Ownership History
Date
Name
Owned For
Owner Type
Purchase Details
Closed on
Dec 13, 2021
Sold by
Rosenberg Eric and Kato Terumi
Bought by
Jordan Stefan C
Current Estimated Value
Home Financials for this Owner
Home Financials are based on the most recent Mortgage that was taken out on this home.
Original Mortgage
$168,150
Outstanding Balance
$154,716
Interest Rate
3.14%
Mortgage Type
New Conventional
Estimated Equity
$65,648
Purchase Details
Closed on
Aug 25, 2004
Sold by
Marble Noell
Bought by
Rosenberg Eric and Kato Terumi
Home Financials for this Owner
Home Financials are based on the most recent Mortgage that was taken out on this home.
Original Mortgage
$67,500
Interest Rate
5.95%
Mortgage Type
Seller Take Back
Purchase Details
Closed on
Feb 14, 1997
Sold by
Marble Noell and Marble Patricia
Bought by
Marble Noell and Marble Patricia
Create a Home Valuation Report for This Property
The Home Valuation Report is an in-depth analysis detailing your home's value as well as a comparison with similar homes in the area
Home Values in the Area
Average Home Value in this Area
Purchase History
| Date | Buyer | Sale Price | Title Company |
|---|---|---|---|
| Jordan Stefan C | $177,000 | First Centennial Reno | |
| Rosenberg Eric | $67,500 | Western Title Incorporated | |
| Marble Noell | -- | -- |
Source: Public Records
Mortgage History
| Date | Status | Borrower | Loan Amount |
|---|---|---|---|
| Open | Jordan Stefan C | $168,150 | |
| Previous Owner | Rosenberg Eric | $67,500 |
Source: Public Records
Tax History Compared to Growth
Tax History
| Year | Tax Paid | Tax Assessment Tax Assessment Total Assessment is a certain percentage of the fair market value that is determined by local assessors to be the total taxable value of land and additions on the property. | Land | Improvement |
|---|---|---|---|---|
| 2025 | $565 | $31,128 | $14,490 | $16,638 |
| 2024 | $565 | $32,031 | $14,490 | $17,541 |
| 2023 | $525 | $29,415 | $13,650 | $15,765 |
| 2022 | $487 | $25,062 | $11,375 | $13,687 |
| 2021 | $450 | $23,027 | $9,170 | $13,857 |
| 2020 | $433 | $23,378 | $9,170 | $14,208 |
| 2019 | $421 | $20,812 | $6,685 | $14,127 |
| 2018 | $402 | $17,414 | $4,445 | $12,969 |
| 2017 | $389 | $17,446 | $4,375 | $13,071 |
| 2016 | $381 | $17,794 | $4,130 | $13,664 |
| 2015 | $291 | $16,222 | $2,800 | $13,422 |
| 2014 | $372 | $11,246 | $2,450 | $8,796 |
| 2013 | -- | $9,619 | $1,575 | $8,044 |
Source: Public Records
Map
Nearby Homes
- 2136 Roundhouse Rd
- 2168 Cannonball Rd
- 2335 Roundhouse Rd
- 2011 H St
- 2380 Roundhouse Rd
- 2002 F St
- 2385 Pauline Ave
- 1756 I St
- 1830 C St
- 1720 G St
- 1889 Merchant St
- 1841 Merchant St
- 848 Rock Blvd
- 234 18th St
- 1855 Verano Dr
- 1560 Steven Ct Unit 2
- 973 Damon Ln
- 1536 Irene Way
- 1527 Steven Ct
- 1780 Greenbrae Dr
- 2108 Roundhouse Rd
- 2102 Roundhouse Rd Unit 2
- 2114 Roundhouse Rd
- 2112 Roundhouse Rd Unit 5
- 2104 Roundhouse Rd
- 2106 Roundhouse Rd Unit 3
- 2110 Roundhouse Rd Unit 6
- 2122 Roundhouse Rd Unit 1
- 2130 Roundhouse Rd
- 2101 Roundhouse Rd
- 2116 Roundhouse Rd
- 2124 Roundhouse Rd
- 2140 Roundhouse Rd
- 2109 Roundhouse Rd Unit 7
- 2123 G St
- 2132 Roundhouse Rd
- 2103 Roundhouse Rd Unit 4
- 2127 G St
- 2146 Roundhouse Rd
- 2138 Roundhouse Rd