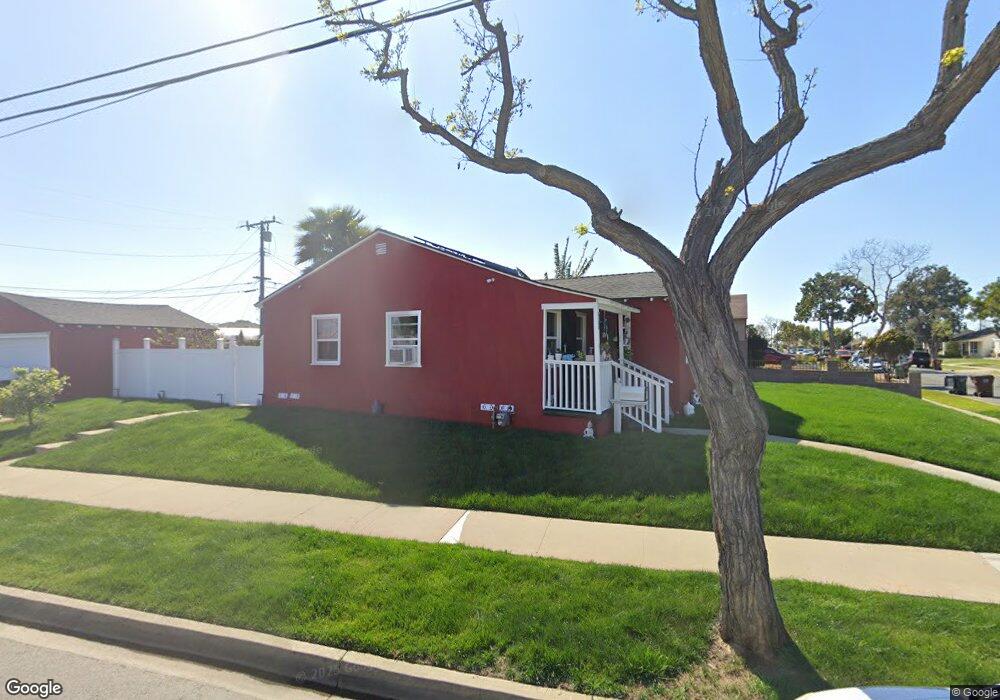
2100 W 152nd St Compton, CA 90220
Estimated Value: $582,000 - $683,000
3
Beds
1
Bath
1,032
Sq Ft
$617/Sq Ft
Est. Value
About This Home
This home is located at 2100 W 152nd St, Compton, CA 90220 and is currently estimated at $636,517, approximately $616 per square foot. 2100 W 152nd St is a home located in Los Angeles County with nearby schools including Bursch Elementary School, Enterprise Middle School, and Compton High School.
Ownership History
Date
Name
Owned For
Owner Type
Purchase Details
Closed on
Mar 24, 2008
Sold by
Muhammad Rodney Blaine
Bought by
Avant Trina Lee
Current Estimated Value
Home Financials for this Owner
Home Financials are based on the most recent Mortgage that was taken out on this home.
Original Mortgage
$284,000
Outstanding Balance
$176,738
Interest Rate
5.72%
Mortgage Type
New Conventional
Estimated Equity
$459,779
Purchase Details
Closed on
Feb 11, 2000
Sold by
Dnh Properties
Bought by
Avant Trina Lee
Home Financials for this Owner
Home Financials are based on the most recent Mortgage that was taken out on this home.
Original Mortgage
$124,169
Interest Rate
8.38%
Mortgage Type
FHA
Purchase Details
Closed on
Nov 30, 1999
Sold by
Ruth B Harris Trust and Stephen E
Bought by
Dhp Investments
Purchase Details
Closed on
May 3, 1995
Sold by
Harris Ruth B
Bought by
Webber Stephen E and The Ruth B Harris Trust For Ch
Create a Home Valuation Report for This Property
The Home Valuation Report is an in-depth analysis detailing your home's value as well as a comparison with similar homes in the area
Home Values in the Area
Average Home Value in this Area
Purchase History
| Date | Buyer | Sale Price | Title Company |
|---|---|---|---|
| Avant Trina Lee | -- | Fidelity National Title Co | |
| Avant Trina Lee | $125,000 | First American Title | |
| Dhp Investments | $76,000 | First American Title | |
| Webber Stephen E | -- | -- | |
| Webber Stephen E | -- | -- | |
| Harris Ruth B | -- | -- |
Source: Public Records
Mortgage History
| Date | Status | Borrower | Loan Amount |
|---|---|---|---|
| Open | Avant Trina Lee | $284,000 | |
| Previous Owner | Avant Trina Lee | $124,169 |
Source: Public Records
Tax History
| Year | Tax Paid | Tax Assessment Tax Assessment Total Assessment is a certain percentage of the fair market value that is determined by local assessors to be the total taxable value of land and additions on the property. | Land | Improvement |
|---|---|---|---|---|
| 2025 | $3,862 | $192,094 | $108,342 | $83,752 |
| 2024 | $3,862 | $188,328 | $106,218 | $82,110 |
| 2023 | $3,808 | $184,636 | $104,136 | $80,500 |
| 2022 | $3,604 | $181,017 | $102,095 | $78,922 |
| 2021 | $3,305 | $177,469 | $100,094 | $77,375 |
| 2019 | $3,503 | $172,207 | $97,126 | $75,081 |
| 2018 | $3,402 | $168,831 | $95,222 | $73,609 |
| 2016 | $3,215 | $162,276 | $91,525 | $70,751 |
| 2015 | $3,078 | $159,840 | $90,151 | $69,689 |
| 2014 | $3,026 | $156,710 | $88,386 | $68,324 |
Source: Public Records
Map
Nearby Homes
- 2202 W 153rd St
- 2215 W 153rd St
- 1802 W 153rd St
- 1512 W 152nd St
- 1143 E 150th St
- 1498 W Compton Blvd
- 1485 W 154th St
- 1616 W Palmer St
- 620 S Barclay Ave
- 705 S Corlett Ave
- 1033 E 149th St
- 431 S Tajauta Ave
- 14513 S Loness Ave
- 15520 S Mckinley Ave
- 14502 S Keene Ave
- 14609 S Cahita Ave
- 2404 W Alondra Blvd
- 1317 W School St
- 801 E Compton Blvd
- 2412 W Raymond St
- 2110 W 152nd St
- 2105 W 153rd St
- 2101 W 153rd St
- 2109 W 153rd St
- 220 S Amantha Ave
- 2114 W 152nd St
- 226 S Amantha Ave
- 216 S Amantha Ave
- 2117 W 153rd St
- 2101 W 152nd St
- 302 S Amantha Ave
- 212 S Amantha Ave
- 2105 W 152nd St
- 2118 W 152nd St
- 304 S Amantha Ave
- 2121 W 153rd St
- 210 S Amantha Ave
- 2109 W 152nd St
- 308 S Amantha Ave
- 2117 W 152nd St
Your Personal Tour Guide
Ask me questions while you tour the home.