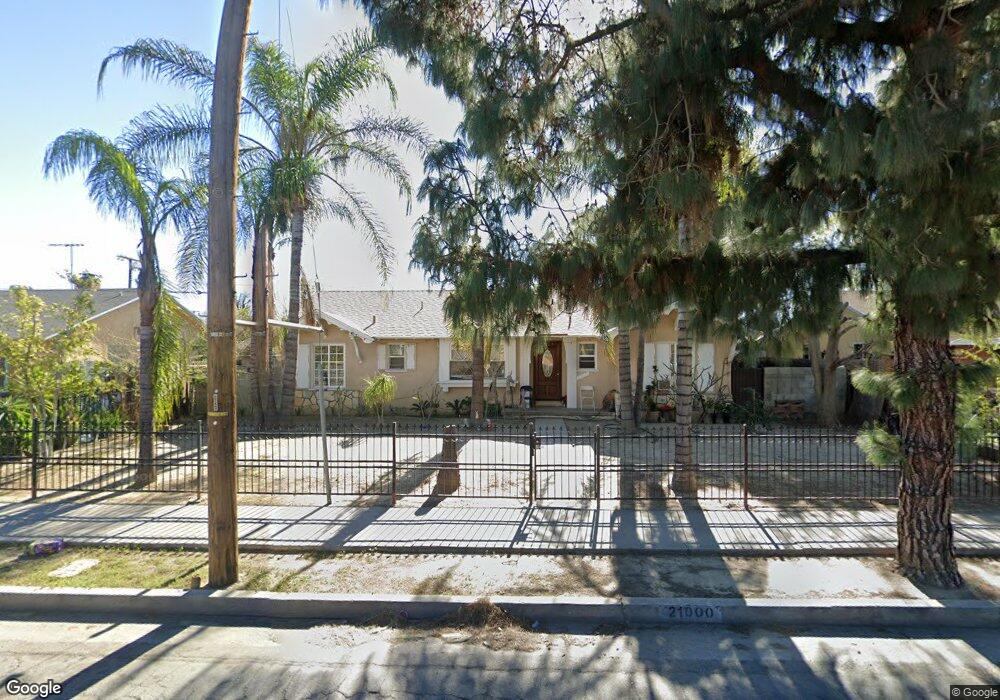
21000 Roscoe Blvd Canoga Park, CA 91304
Canoga Park NeighborhoodEstimated Value: $779,000 - $843,000
3
Beds
2
Baths
1,386
Sq Ft
$587/Sq Ft
Est. Value
About This Home
This home is located at 21000 Roscoe Blvd, Canoga Park, CA 91304 and is currently estimated at $813,766, approximately $587 per square foot. 21000 Roscoe Blvd is a home located in Los Angeles County with nearby schools including Sunny Brae Avenue Elementary School, Christopher Columbus Middle School, and Canoga Park Senior High School.
Ownership History
Date
Name
Owned For
Owner Type
Purchase Details
Closed on
Mar 21, 2016
Sold by
Ambriz Jose
Bought by
Ambriz Jose and Ambriz Concepcion M Leon
Current Estimated Value
Home Financials for this Owner
Home Financials are based on the most recent Mortgage that was taken out on this home.
Original Mortgage
$92,000
Outstanding Balance
$72,793
Interest Rate
3.64%
Mortgage Type
New Conventional
Estimated Equity
$740,973
Purchase Details
Closed on
Jun 17, 1999
Sold by
Ambriz Ruby
Bought by
Ambriz Jose and Ambriz Ruby
Purchase Details
Closed on
May 24, 1999
Sold by
Ambriz Jose
Bought by
Ambriz Ruby
Purchase Details
Closed on
Feb 19, 1998
Sold by
Mulligan William C
Bought by
Ambriz Jose and Ambriz Ruby
Home Financials for this Owner
Home Financials are based on the most recent Mortgage that was taken out on this home.
Original Mortgage
$132,528
Interest Rate
7.06%
Mortgage Type
FHA
Purchase Details
Closed on
Jun 5, 1996
Sold by
Mulligan William C
Bought by
Mulligan William C and Mulligan Ruby May
Create a Home Valuation Report for This Property
The Home Valuation Report is an in-depth analysis detailing your home's value as well as a comparison with similar homes in the area
Home Values in the Area
Average Home Value in this Area
Purchase History
| Date | Buyer | Sale Price | Title Company |
|---|---|---|---|
| Ambriz Jose | -- | Ticor | |
| Ambriz Jose | -- | -- | |
| Ambriz Ruby | -- | -- | |
| Ambriz Jose | $134,000 | Southland Title | |
| Mulligan William C | -- | -- |
Source: Public Records
Mortgage History
| Date | Status | Borrower | Loan Amount |
|---|---|---|---|
| Open | Ambriz Jose | $92,000 | |
| Previous Owner | Ambriz Jose | $132,528 |
Source: Public Records
Tax History Compared to Growth
Tax History
| Year | Tax Paid | Tax Assessment Tax Assessment Total Assessment is a certain percentage of the fair market value that is determined by local assessors to be the total taxable value of land and additions on the property. | Land | Improvement |
|---|---|---|---|---|
| 2025 | $4,696 | $367,310 | $233,843 | $133,467 |
| 2024 | $4,696 | $360,108 | $229,258 | $130,850 |
| 2023 | $4,611 | $353,048 | $224,763 | $128,285 |
| 2022 | $4,405 | $346,126 | $220,356 | $125,770 |
| 2021 | $4,348 | $339,340 | $216,036 | $123,304 |
| 2019 | $4,224 | $329,277 | $209,629 | $119,648 |
| 2018 | $4,120 | $322,821 | $205,519 | $117,302 |
| 2016 | $2,407 | $189,288 | $112,457 | $76,831 |
| 2015 | $2,373 | $186,445 | $110,768 | $75,677 |
| 2014 | $2,389 | $182,794 | $108,599 | $74,195 |
Source: Public Records
Map
Nearby Homes
- 20951 Roscoe Blvd
- 20920 Community St Unit 7
- 8341 De Soto Ave Unit 10
- 21050 Community St
- 21219 Roscoe Blvd Unit 211
- 21032 Baltar St
- 20921 Community St Unit 12
- 20807 Roscoe Blvd Unit 1
- 8328 N Cooper Place
- 20851 Community St Unit 10
- 20737 Roscoe Blvd Unit 301
- 20737 Roscoe Blvd Unit 704
- 21315 Community St
- 8021 Mcnulty Ave
- 20828 Blythe St
- 20651 Roscoe Blvd Unit L
- 21305 Chase St
- 8540 De Soto Ave Unit 49
- 8558 De Soto Ave Unit 41
- 20617 Schoenborn St
- 20956 Roscoe Blvd
- 21006 Roscoe Blvd
- 20957 Burton St
- 20963 Burton St
- 20950 Roscoe Blvd
- 21012 Roscoe Blvd
- 21005 Burton St
- 20953 Burton St
- 21011 Burton St
- 21024 Roscoe Blvd
- 20951 Burton St
- 21019 Burton St
- 21028 Roscoe Blvd
- 21000 Burton St
- 21004 Burton St
- 21025 Burton St
- 21008 Burton St
- 20949 Burton St
- 21034 Roscoe Blvd
- 21014 Burton St