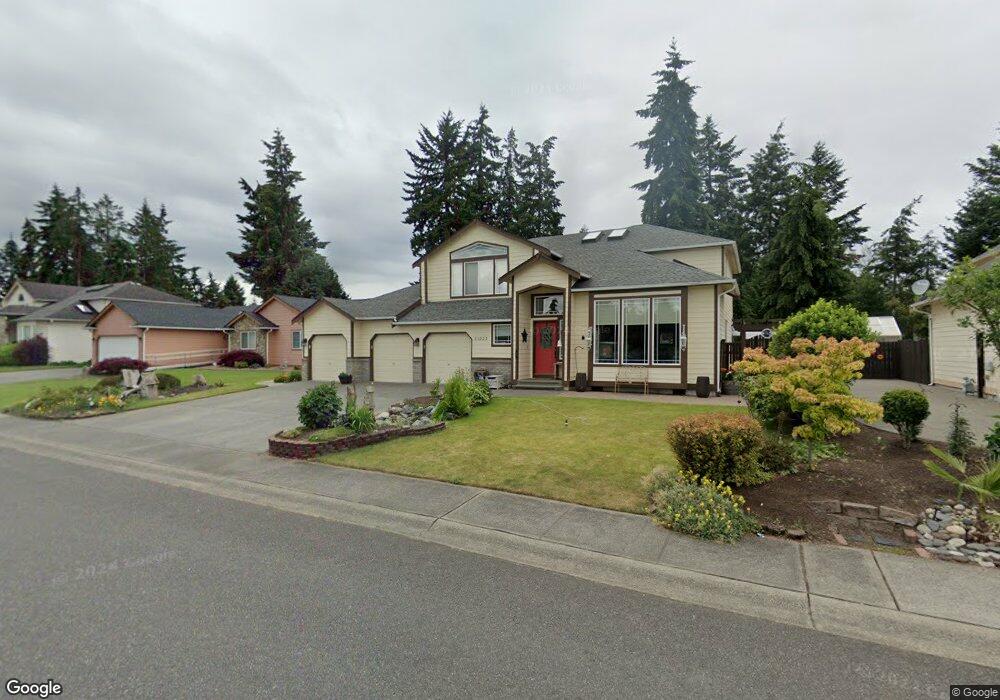
21002 111th Ave E Graham, WA 98338
Estimated Value: $597,050 - $664,000
5
Beds
3
Baths
2,451
Sq Ft
$255/Sq Ft
Est. Value
About This Home
This home is located at 21002 111th Ave E, Graham, WA 98338 and is currently estimated at $624,763, approximately $254 per square foot. 21002 111th Ave E is a home located in Pierce County with nearby schools including Nelson Elementary School, Frontier Middle School, and Graham Kapowsin High School.
Ownership History
Date
Name
Owned For
Owner Type
Purchase Details
Closed on
Apr 8, 2005
Sold by
Sunada Lynnette M
Bought by
Delatorre Edgar R and Delatorre Marla A
Current Estimated Value
Home Financials for this Owner
Home Financials are based on the most recent Mortgage that was taken out on this home.
Original Mortgage
$134,000
Outstanding Balance
$66,756
Interest Rate
5.25%
Mortgage Type
Purchase Money Mortgage
Estimated Equity
$558,007
Purchase Details
Closed on
Dec 11, 2002
Sold by
Sunada Lynnette M
Bought by
Sunada Mori S and Sunada Lynette M
Home Financials for this Owner
Home Financials are based on the most recent Mortgage that was taken out on this home.
Original Mortgage
$229,550
Interest Rate
5.5%
Purchase Details
Closed on
Jun 1, 2001
Sold by
Nielson Duaine A
Bought by
Abad Lynnette M
Home Financials for this Owner
Home Financials are based on the most recent Mortgage that was taken out on this home.
Original Mortgage
$227,900
Interest Rate
7.15%
Create a Home Valuation Report for This Property
The Home Valuation Report is an in-depth analysis detailing your home's value as well as a comparison with similar homes in the area
Home Values in the Area
Average Home Value in this Area
Purchase History
| Date | Buyer | Sale Price | Title Company |
|---|---|---|---|
| Delatorre Edgar R | $284,000 | Puget Sound Title Company | |
| Sunada Mori S | -- | Fidelity National Title Comp | |
| Abad Lynnette M | $239,900 | Transnation Title Insurance |
Source: Public Records
Mortgage History
| Date | Status | Borrower | Loan Amount |
|---|---|---|---|
| Open | Delatorre Edgar R | $134,000 | |
| Previous Owner | Sunada Mori S | $229,550 | |
| Previous Owner | Abad Lynnette M | $227,900 |
Source: Public Records
Tax History Compared to Growth
Tax History
| Year | Tax Paid | Tax Assessment Tax Assessment Total Assessment is a certain percentage of the fair market value that is determined by local assessors to be the total taxable value of land and additions on the property. | Land | Improvement |
|---|---|---|---|---|
| 2025 | $5,917 | $550,900 | $176,200 | $374,700 |
| 2024 | $5,917 | $531,700 | $176,200 | $355,500 |
| 2023 | $5,917 | $502,400 | $183,000 | $319,400 |
| 2022 | $5,557 | $523,800 | $173,500 | $350,300 |
| 2021 | $5,081 | $358,700 | $112,500 | $246,200 |
| 2019 | $4,121 | $354,600 | $96,800 | $257,800 |
| 2018 | $4,513 | $329,200 | $81,200 | $248,000 |
| 2017 | $4,403 | $288,500 | $64,000 | $224,500 |
| 2016 | $4,030 | $257,300 | $42,900 | $214,400 |
| 2014 | $3,523 | $238,000 | $42,900 | $195,100 |
| 2013 | $3,523 | $215,700 | $40,500 | $175,200 |
Source: Public Records
Map
Nearby Homes
- 11107 212th St E
- 11220 212th St E
- 11305 207th St E
- 20810 115th Avenue Ct E
- 20216 110th Avenue Ct E
- 20119 112th Ave E
- 10010 219th Street Ct E
- 22006 Meridian (Lot 2) E
- 10525 197th Street Ct E Unit 51
- 22010 Meridian (Lot 3) E
- 22010 Meridian Ave E
- 20412 97th Avenue Ct E Unit 3
- 9822 201st St E
- 10609 197th St E
- 9705 205th St E Unit 29
- 20432 97th Ave E Unit 8
- 20404 97th Ave E
- 20408 97th Ave E Unit 2
- 20428 97th Ave E
- 20404 97th Ave E Unit 1
- 21006 111th Ave E
- 21010 111th Ave E
- 20908 111th Ave E
- 21005 111th Ave E
- 21005 111th Avenue Ct E
- 21009 111th Ave E
- 21009 111th Ave E
- 20904 111th Ave E
- 21009 111th Avenue Ct E
- 21013 111th Ave E
- 21013 111th Ave E
- 21013 111th Avenue Ct E
- 11106 209th Street Ct E
- 20822 111th Ave E
- 21012 111th Avenue Ct E
- 21018 111th Ave E
- 21017 111th Ave E
- 21017 111th Ave E
- 11110 209th Street Ct E