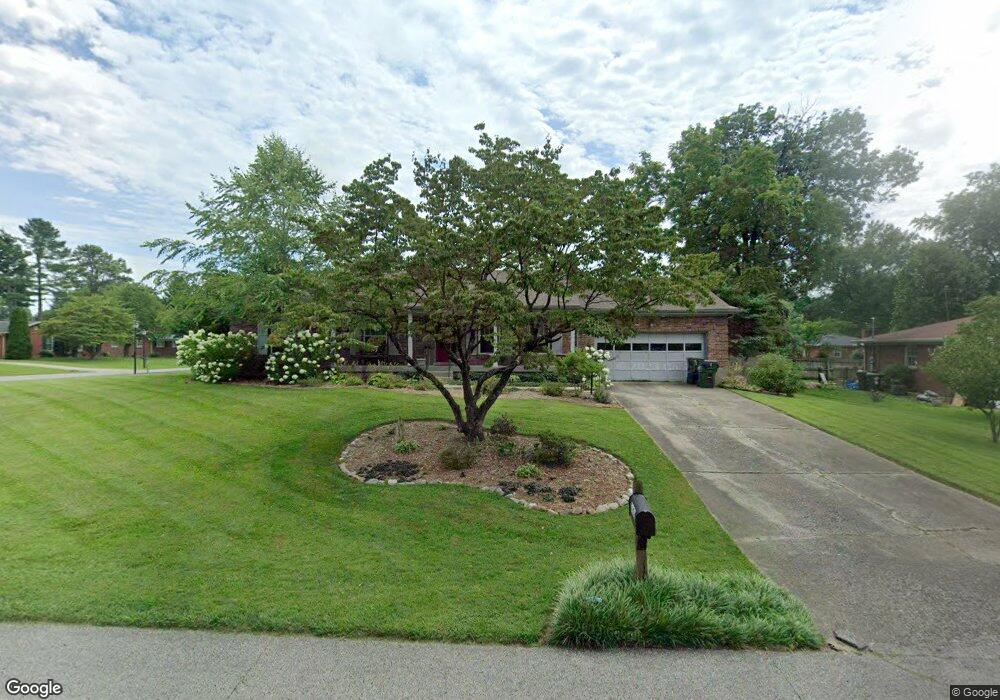
2101 Ann Marie Dr Louisville, KY 40299
Estimated Value: $282,000 - $306,133
3
Beds
2
Baths
1,349
Sq Ft
$220/Sq Ft
Est. Value
About This Home
This home is located at 2101 Ann Marie Dr, Louisville, KY 40299 and is currently estimated at $297,283, approximately $220 per square foot. 2101 Ann Marie Dr is a home located in Jefferson County with nearby schools including Cochrane Elementary School, Tully Elementary School, and Jeffersontown Elementary School.
Ownership History
Date
Name
Owned For
Owner Type
Purchase Details
Closed on
Jan 11, 2019
Sold by
Taylor Jonathan D
Bought by
Sica Carrie and Borders Mary Jean
Current Estimated Value
Purchase Details
Closed on
Jan 21, 2016
Sold by
Taylor Jonathan D and Sica Carrie
Bought by
Border Mary Jean
Home Financials for this Owner
Home Financials are based on the most recent Mortgage that was taken out on this home.
Original Mortgage
$159,511
Interest Rate
5%
Mortgage Type
Land Contract Argmt. Of Sale
Purchase Details
Closed on
Sep 23, 2010
Sold by
Crawford Olivia Ann
Bought by
Taylor Jonathan
Purchase Details
Closed on
Aug 26, 2005
Sold by
Miller Charles Douglas and Miller Joanna
Bought by
Taylor Jonathan D
Home Financials for this Owner
Home Financials are based on the most recent Mortgage that was taken out on this home.
Original Mortgage
$157,000
Interest Rate
5.71%
Mortgage Type
VA
Create a Home Valuation Report for This Property
The Home Valuation Report is an in-depth analysis detailing your home's value as well as a comparison with similar homes in the area
Home Values in the Area
Average Home Value in this Area
Purchase History
| Date | Buyer | Sale Price | Title Company |
|---|---|---|---|
| Sica Carrie | $163,500 | None Available | |
| Border Mary Jean | $163,500 | None Available | |
| Taylor Jonathan | -- | None Available | |
| Taylor Jonathan D | $157,000 | Agency Title |
Source: Public Records
Mortgage History
| Date | Status | Borrower | Loan Amount |
|---|---|---|---|
| Previous Owner | Border Mary Jean | $159,511 | |
| Previous Owner | Taylor Jonathan D | $157,000 |
Source: Public Records
Tax History Compared to Growth
Tax History
| Year | Tax Paid | Tax Assessment Tax Assessment Total Assessment is a certain percentage of the fair market value that is determined by local assessors to be the total taxable value of land and additions on the property. | Land | Improvement |
|---|---|---|---|---|
| 2024 | $2,509 | $267,430 | $56,650 | $210,780 |
| 2023 | $2,359 | $201,950 | $37,080 | $164,870 |
| 2022 | $2,591 | $201,950 | $37,080 | $164,870 |
| 2021 | $2,497 | $201,950 | $37,080 | $164,870 |
| 2020 | $1,952 | $168,740 | $35,000 | $133,740 |
| 2019 | $1,913 | $168,740 | $35,000 | $133,740 |
| 2018 | $236 | $168,740 | $35,000 | $133,740 |
| 2017 | $1,771 | $168,740 | $35,000 | $133,740 |
| 2013 | $1,570 | $157,000 | $24,000 | $133,000 |
Source: Public Records
Map
Nearby Homes
- 2517 Melody Way
- 2300 Janlyn Rd
- 1807 Janlyn Rd
- 2609 Harmony Rd
- 2609 Swing Ct
- 2310 Janlyn Rd
- 2209 Old Hickory Rd
- 9218 Axminster Dr
- 2406 Old Hickory Rd
- 9213 Wendell Way
- 9314 Pine Lake Dr Unit 201
- 3002 Clevan Way Unit 102
- 9308 Pine Lake Dr Unit 101
- 2804 Gleeson Ln
- 9416 Old Six Mile Ln
- 10109 Merioneth Dr
- 9205 Auburn Ave
- 3009 Lynnwood Way
- 3103 Lynnwood Way
- 3125 Lynnwood Way
- 2013 Janlyn Rd
- 2103 Ann Marie Dr
- 2612 Merriwood Dr
- 2011 Janlyn Rd
- 2610 Merriwood Dr
- 2102 Ann Marie Dr
- 2014 Janlyn Rd
- 2012 Janlyn Rd
- 2016 Janlyn Rd
- 2009 Janlyn Rd
- 2010 Janlyn Rd
- 2608 Merriwood Dr
- 2104 Ann Marie Dr
- 2018 Janlyn Rd
- 2103 Janlyn Rd
- 2008 Janlyn Rd
- 2020 Janlyn Rd
- 2606 Merriwood Dr
- 2105 Janlyn Rd
- 2007 Janlyn Rd