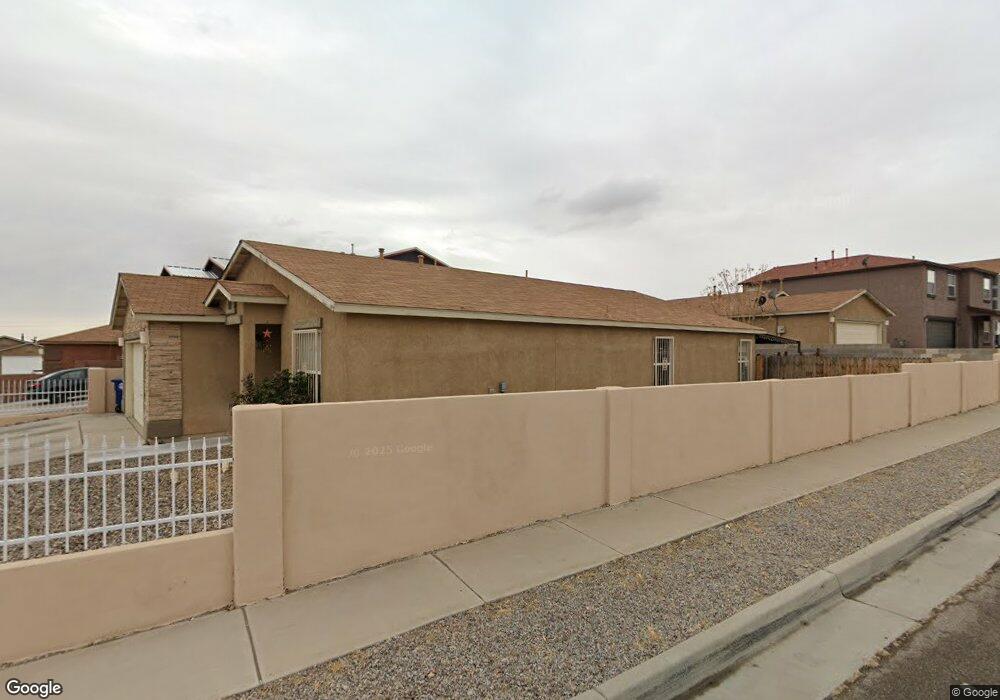
2101 Canter St SW Albuquerque, NM 87121
Southwest Heights NeighborhoodEstimated Value: $290,920 - $296,000
3
Beds
2
Baths
1,500
Sq Ft
$195/Sq Ft
Est. Value
About This Home
This home is located at 2101 Canter St SW, Albuquerque, NM 87121 and is currently estimated at $292,980, approximately $195 per square foot. 2101 Canter St SW is a home located in Bernalillo County with nearby schools including Carlos Rey Elementary School, Tony Hillerman Middle School, and Atrisco Heritage Academy High School.
Ownership History
Date
Name
Owned For
Owner Type
Purchase Details
Closed on
Apr 20, 2020
Sold by
Ramos Salvador and Alvarez Monica R
Bought by
Ramos Yesenia
Current Estimated Value
Home Financials for this Owner
Home Financials are based on the most recent Mortgage that was taken out on this home.
Original Mortgage
$88,700
Outstanding Balance
$78,871
Interest Rate
3.6%
Mortgage Type
New Conventional
Estimated Equity
$214,109
Purchase Details
Closed on
Mar 29, 2010
Sold by
Federal Home Loan Mortgage Corporation
Bought by
Ramos Salvador
Home Financials for this Owner
Home Financials are based on the most recent Mortgage that was taken out on this home.
Original Mortgage
$111,935
Interest Rate
4.93%
Mortgage Type
FHA
Purchase Details
Closed on
Jun 28, 2005
Sold by
Centex Homes
Bought by
Masud Milton
Home Financials for this Owner
Home Financials are based on the most recent Mortgage that was taken out on this home.
Original Mortgage
$106,816
Interest Rate
7.12%
Create a Home Valuation Report for This Property
The Home Valuation Report is an in-depth analysis detailing your home's value as well as a comparison with similar homes in the area
Home Values in the Area
Average Home Value in this Area
Purchase History
| Date | Buyer | Sale Price | Title Company |
|---|---|---|---|
| Ramos Yesenia | -- | Stewart Title | |
| Ramos Salvador | -- | Servicelink | |
| Masud Milton | -- | Commerce Title Co Of Nm Llc |
Source: Public Records
Mortgage History
| Date | Status | Borrower | Loan Amount |
|---|---|---|---|
| Open | Ramos Yesenia | $88,700 | |
| Previous Owner | Ramos Salvador | $111,935 | |
| Previous Owner | Masud Milton | $106,816 |
Source: Public Records
Tax History Compared to Growth
Tax History
| Year | Tax Paid | Tax Assessment Tax Assessment Total Assessment is a certain percentage of the fair market value that is determined by local assessors to be the total taxable value of land and additions on the property. | Land | Improvement |
|---|---|---|---|---|
| 2024 | $1,937 | $45,921 | $12,567 | $33,354 |
| 2023 | $1,905 | $44,584 | $12,201 | $32,383 |
| 2022 | $1,841 | $43,286 | $11,846 | $31,440 |
| 2021 | $1,779 | $42,025 | $11,501 | $30,524 |
| 2020 | $1,750 | $40,801 | $11,166 | $29,635 |
| 2019 | $1,699 | $39,613 | $10,841 | $28,772 |
| 2018 | $1,638 | $39,613 | $10,841 | $28,772 |
| 2017 | $1,588 | $38,460 | $10,525 | $27,935 |
| 2016 | $1,542 | $36,252 | $9,921 | $26,331 |
| 2015 | $35,196 | $35,196 | $9,632 | $25,564 |
| 2014 | $1,507 | $35,496 | $9,632 | $25,864 |
| 2013 | -- | $35,796 | $9,632 | $26,164 |
Source: Public Records
Map
Nearby Homes
- 2105 Hermosa Creek Dr SW
- 2408 Sun Gate Trail SW
- 9909 Saddlehorn Trail SW
- 10427 Sandy Flats Ave SW
- 2627 Sun Canyon Ln SW
- 2401 Ghost Ranch St SW
- 2615 Silver Star Dr SW
- 9901 Morning Sun Trail SW
- 2704 Ghost Ranch St SW Unit 15
- 10608 Buck Island Rd SW
- 1327 Amole Vista St SW
- 10519 Valedon Ln SW
- 9801 Sun Chaser Trail SW Unit 1
- 10915 Denton Rd SW
- 10512 Valedon Ln SW
- 10516 Valedon Ln SW
- 10224 Cristalino Rd SW
- 2204 San Leon St SW
- Plan 3014 - The Sierra at Aspire
- Plan 3004 - The Sawyer at Aspire
- 2105 Canter St SW
- 10044 High Range Rd SW
- 2109 Canter St SW
- 10048 High Range Rd SW
- 10047 Range Rd SW
- 10039 High Range Rd SW
- 2115 Canter St SW
- 10043 High Range Rd SW
- 10035 High Range Rd SW
- 2100 Canter St SW
- 10047 High Range Rd SW
- 10051 Range Rd SW
- 10100 High Range Rd SW
- 10031 High Range Rd SW
- 2108 Canter St SW
- 2116 Canter St SW
- 10055 Range Rd SW
- 10027 High Range Rd SW
- 10104 High Range Rd SW
- 10101 High Range Rd SW