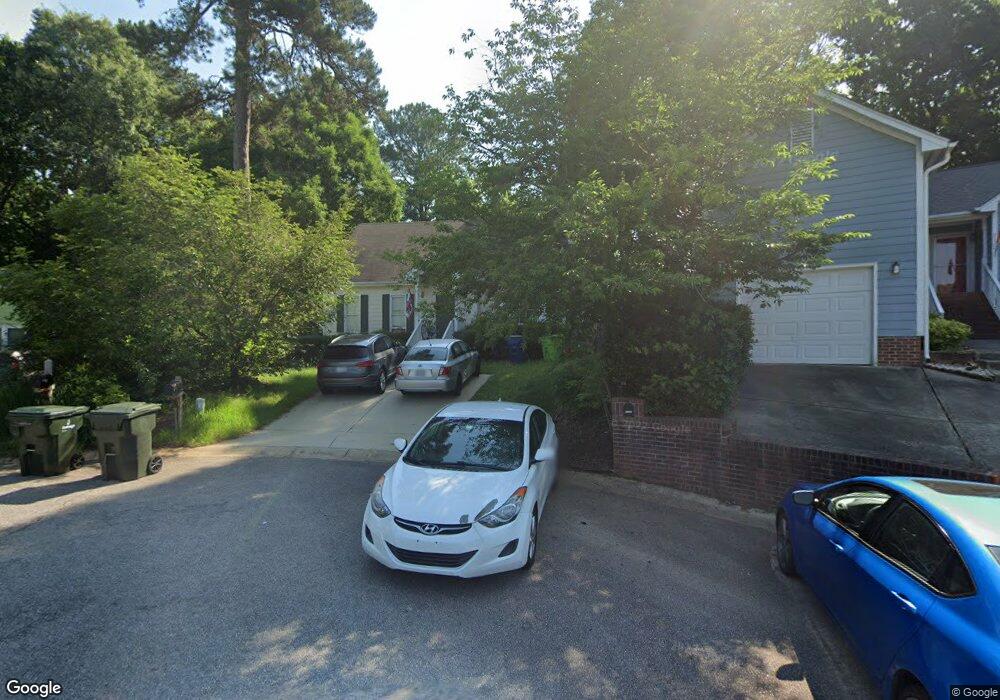
2101 Cardhu Way Raleigh, NC 27603
South Raleigh NeighborhoodEstimated Value: $364,000 - $383,000
4
Beds
3
Baths
2,017
Sq Ft
$187/Sq Ft
Est. Value
About This Home
This home is located at 2101 Cardhu Way, Raleigh, NC 27603 and is currently estimated at $376,802, approximately $186 per square foot. 2101 Cardhu Way is a home located in Wake County with nearby schools including Dillard Drive Magnet Elementary School, Dillard Drive Magnet Middle School, and Longleaf School Of The Arts.
Ownership History
Date
Name
Owned For
Owner Type
Purchase Details
Closed on
Jun 21, 2019
Sold by
Hossain M Moazzem and Hossain Nasima
Bought by
Hossain M Moazzem and Hossain Mimrah
Current Estimated Value
Purchase Details
Closed on
Dec 8, 2017
Sold by
Raina Azhar K and Raina Shehnaz B
Bought by
Hossain Hossain M and Hossain Nasima
Purchase Details
Closed on
Nov 17, 2004
Sold by
Ojeda Francisco J and Ojeda Kelly T
Bought by
Raina Azhar K and Raina Shehnaz B
Home Financials for this Owner
Home Financials are based on the most recent Mortgage that was taken out on this home.
Original Mortgage
$167,000
Interest Rate
4.87%
Mortgage Type
Purchase Money Mortgage
Purchase Details
Closed on
May 28, 1999
Sold by
Kristine Ford Davey Davey Francis Walter
Bought by
Ojeda Francisco J and Ojeda Kelly T
Home Financials for this Owner
Home Financials are based on the most recent Mortgage that was taken out on this home.
Original Mortgage
$107,200
Interest Rate
6.84%
Create a Home Valuation Report for This Property
The Home Valuation Report is an in-depth analysis detailing your home's value as well as a comparison with similar homes in the area
Home Values in the Area
Average Home Value in this Area
Purchase History
| Date | Buyer | Sale Price | Title Company |
|---|---|---|---|
| Hossain M Moazzem | -- | None Available | |
| Hossain M Moazzem M | -- | None Listed On Document | |
| Hossain Hossain M | $189,000 | None Available | |
| Raina Azhar K | $167,000 | -- | |
| Ojeda Francisco J | $134,000 | -- |
Source: Public Records
Mortgage History
| Date | Status | Borrower | Loan Amount |
|---|---|---|---|
| Previous Owner | Raina Azhar K | $167,000 | |
| Previous Owner | Ojeda Francisco J | $107,200 |
Source: Public Records
Tax History Compared to Growth
Tax History
| Year | Tax Paid | Tax Assessment Tax Assessment Total Assessment is a certain percentage of the fair market value that is determined by local assessors to be the total taxable value of land and additions on the property. | Land | Improvement |
|---|---|---|---|---|
| 2025 | $2,996 | $341,207 | $140,000 | $201,207 |
| 2024 | $2,983 | $341,207 | $140,000 | $201,207 |
| 2023 | $2,548 | $231,945 | $60,000 | $171,945 |
| 2022 | $2,368 | $231,945 | $60,000 | $171,945 |
| 2021 | $2,277 | $231,945 | $60,000 | $171,945 |
| 2020 | $2,236 | $231,945 | $60,000 | $171,945 |
| 2019 | $2,083 | $178,046 | $52,000 | $126,046 |
| 2018 | $1,965 | $178,046 | $52,000 | $126,046 |
| 2017 | $1,872 | $178,046 | $52,000 | $126,046 |
| 2016 | $1,834 | $178,046 | $52,000 | $126,046 |
| 2015 | $1,739 | $165,991 | $44,000 | $121,991 |
| 2014 | -- | $165,991 | $44,000 | $121,991 |
Source: Public Records
Map
Nearby Homes
- 2108 Leadenhall Way
- 2524 Beech Gap Ct
- 2221 Mountain Mist Ct Unit 201
- 1901 Trailwood Heights Ln Unit 304
- 2201 Mountain Mist Ct Unit 103
- 2901 Alder Ridge Ln
- 2831 Barrymore St Unit 107
- 2816 Alder Ridge Ln
- 3008 Isabella Dr
- 2505 Ferndown Ct
- 2920 Barrymore St Unit 106
- 2524 Ferndown Ct
- 2271 Trailwood Valley Cir
- 2228 Trailwood Valley Cir
- 2607 Sterling Park Dr
- 2659 Broad Oaks Place
- 3223 Tryon Rd
- 2639 Broad Oaks Place Unit 21
- 3115 Tryon Rd
- 3109 Tryon Rd
- 2100 Cardhu Way
- 2426 Trailwood Hills Dr
- 2428 Trailwood Hills Dr
- 2420 Trailwood Hills Dr
- 2104 Cardhu Way
- 2109 Cardhu Way
- 2432 Trailwood Hills Dr
- 2416 Trailwood Hills Dr
- 2108 Cardhu Way
- 2220 Leadenhall Way
- 2224 Leadenhall Way
- 2436 Trailwood Hills Dr
- 2412 Trailwood Hills Dr
- 2429 Trailwood Hills Dr
- 2216 Leadenhall Way
- 2228 Leadenhall Way
- 2421 Trailwood Hills Dr
- 2433 Trailwood Hills Dr
- 2417 Trailwood Hills Dr
- 2217 Leadenhall Way