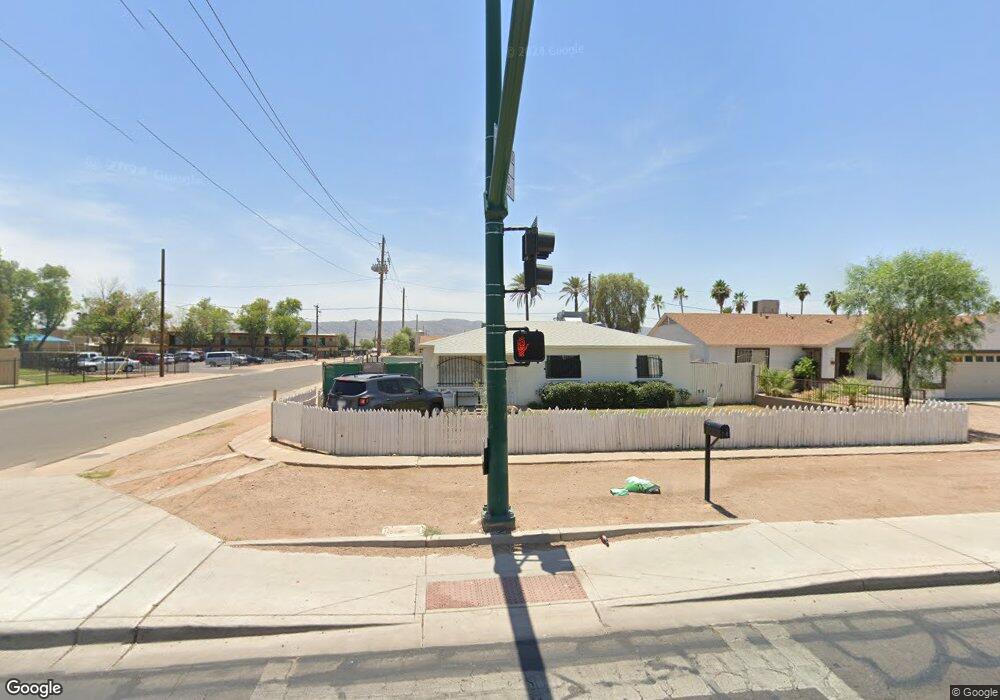
2101 E Broadway Rd Phoenix, AZ 85040
South Mountain NeighborhoodEstimated Value: $244,000 - $334,000
Studio
2
Baths
1,324
Sq Ft
$223/Sq Ft
Est. Value
About This Home
This home is located at 2101 E Broadway Rd, Phoenix, AZ 85040 and is currently estimated at $295,375, approximately $223 per square foot. 2101 E Broadway Rd is a home located in Maricopa County with nearby schools including Percy L Julian School, South Mountain High School, and Phoenix Coding Academy.
Ownership History
Date
Name
Owned For
Owner Type
Purchase Details
Closed on
Oct 19, 2007
Sold by
Ruano Nicolas
Bought by
Vargas Marco Tulio and Orellana Santo L
Current Estimated Value
Purchase Details
Closed on
Oct 16, 2006
Sold by
Giron Mario Jesus
Bought by
Ruano Nicolas
Purchase Details
Closed on
Jul 21, 2005
Sold by
Ramirez Reina
Bought by
Giron Mario
Home Financials for this Owner
Home Financials are based on the most recent Mortgage that was taken out on this home.
Original Mortgage
$119,200
Interest Rate
6.1%
Mortgage Type
Purchase Money Mortgage
Purchase Details
Closed on
Jul 13, 2005
Sold by
Thompson Agnes H
Bought by
Giron Mario Jesus and Giron Mario
Home Financials for this Owner
Home Financials are based on the most recent Mortgage that was taken out on this home.
Original Mortgage
$119,200
Interest Rate
6.1%
Mortgage Type
Purchase Money Mortgage
Create a Home Valuation Report for This Property
The Home Valuation Report is an in-depth analysis detailing your home's value as well as a comparison with similar homes in the area
Home Values in the Area
Average Home Value in this Area
Purchase History
| Date | Buyer | Sale Price | Title Company |
|---|---|---|---|
| Vargas Marco Tulio | -- | None Available | |
| Ruano Nicolas | -- | None Available | |
| Giron Mario | -- | Guaranty Title Agency | |
| Giron Mario Jesus | $149,000 | Guaranty Title Agency |
Source: Public Records
Mortgage History
| Date | Status | Borrower | Loan Amount |
|---|---|---|---|
| Previous Owner | Giron Mario | $119,200 | |
| Previous Owner | Giron Mario Jesus | $119,200 |
Source: Public Records
Tax History
| Year | Tax Paid | Tax Assessment Tax Assessment Total Assessment is a certain percentage of the fair market value that is determined by local assessors to be the total taxable value of land and additions on the property. | Land | Improvement |
|---|---|---|---|---|
| 2025 | $630 | $4,176 | -- | -- |
| 2024 | $596 | $3,978 | -- | -- |
| 2023 | $596 | $19,760 | $3,950 | $15,810 |
| 2022 | $584 | $14,960 | $2,990 | $11,970 |
| 2021 | $596 | $13,050 | $2,610 | $10,440 |
| 2020 | $589 | $11,720 | $2,340 | $9,380 |
| 2019 | $570 | $9,130 | $1,820 | $7,310 |
| 2018 | $554 | $7,820 | $1,560 | $6,260 |
| 2017 | $528 | $5,710 | $1,140 | $4,570 |
| 2016 | $565 | $5,410 | $1,080 | $4,330 |
| 2015 | $410 | $3,880 | $770 | $3,110 |
Source: Public Records
Map
Nearby Homes
- 4228 S 19th Place
- 2854 E Wier Ave
- 2332 E Marguerite Ave
- 2326 E Levi Dr
- 1914 E Illini St
- 5020 S 20th Place
- 5024 S 20th St
- 820 E Chipman Rd Unit 1
- 2335 E Levi Dr
- 1854 E Roeser Rd
- 4010 S 24th Place
- 1618 E Wood St
- 1636 E Encinas Ln Unit 11
- 2437 E Tamarisk Ave
- 3641 S 17th St Unit 9
- 1813 Grenadine Rd
- 2501 E Jones Ave
- 2511 E Broadway Rd
- 1747 E Grove St
- 5020 S 16th St
- 4403 S 21st St
- 2105 E Broadway Rd
- 4415 S 21st St
- 2109 E Broadway Rd
- 4411 S 21st St
- 2019 E Broadway Rd
- 2114 E Corona Ave
- 2111 E Broadway Rd
- 2106 E Broadway Rd
- 4427 S 21st St
- 2117 E Broadway Rd
- 2118 E Corona Ave
- 2128 E Corona Ave
- 2014 E Broadway Rd
- 2123 E Broadway Rd
- 4426 S 21st St
- 2122 E Corona Ave
- 2102 E Parkway Dr
- 2010 E Broadway Rd
- 2107 E Corona Ave
Your Personal Tour Guide
Ask me questions while you tour the home.