
2101 NE 35th St Lighthouse Point, FL 33064
2
Beds
2
Baths
1,484
Sq Ft
9,269
Sq Ft Lot
Highlights
- No HOA
- Views
- 1-Story Property
- Circular Driveway
- Tile Flooring
- Central Heating and Cooling System
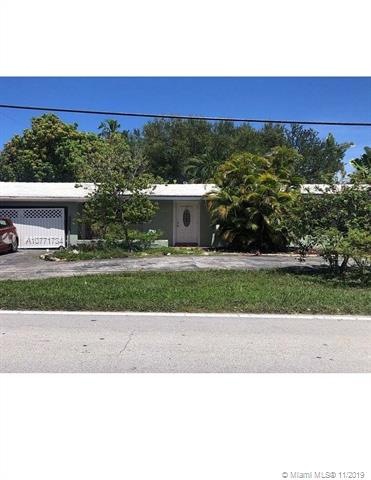
About This Home
As of April 2021(SHORT SALE) Charming 2/2 home in desirable Lighthouse Point neighborhood. 1-car garage, circular driveway,
and porch. This home is ready for you buyer's final touches. This quaint property in Light House Point is close to shopping, restaurants and the beach. THIS HOME IS A MUST SEE!
Home Details
Home Type
- Single Family
Est. Annual Taxes
- $5,876
Year Built
- Built in 1960
Lot Details
- 9,269 Sq Ft Lot
- West Facing Home
Parking
- 1 Car Garage
- Circular Driveway
- Open Parking
Home Design
- Flat Tile Roof
Interior Spaces
- 1,484 Sq Ft Home
- 1-Story Property
- Tile Flooring
- Property Views
Bedrooms and Bathrooms
- 2 Bedrooms
- 2 Full Bathrooms
Utilities
- Central Heating and Cooling System
Community Details
- No Home Owners Association
- Lighthouse Point Ext 2Nd Subdivision
Listing and Financial Details
- Assessor Parcel Number 484319080010
Ownership History
Date
Name
Owned For
Owner Type
Purchase Details
Listed on
Aug 26, 2020
Closed on
Mar 29, 2021
Sold by
Asmina Investment Llc
Bought by
Ross Sloan A
Seller's Agent
Asmaa El Kouhen
Brokers, LLC
Buyer's Agent
Non-Member Mls Agent
List Price
$449,500
Sold Price
$455,000
Premium/Discount to List
$5,500
1.22%
Current Estimated Value
Home Financials for this Owner
Home Financials are based on the most recent Mortgage that was taken out on this home.
Estimated Appreciation
$243,904
Avg. Annual Appreciation
10.71%
Original Mortgage
$432,250
Outstanding Balance
$393,315
Interest Rate
2.8%
Mortgage Type
New Conventional
Estimated Equity
$315,711
Purchase Details
Listed on
Nov 12, 2019
Closed on
Mar 10, 2020
Sold by
Vanzuidam Walter Van
Bought by
Asmina Investment Llc
Seller's Agent
Durel Jones
Breo Realty LLC
Buyer's Agent
Durel Jones
Breo Realty LLC
List Price
$375,000
Sold Price
$291,000
Premium/Discount to List
-$84,000
-22.4%
Home Financials for this Owner
Home Financials are based on the most recent Mortgage that was taken out on this home.
Avg. Annual Appreciation
52.45%
Purchase Details
Closed on
Apr 20, 2009
Sold by
Vanzuidam Catherine M
Bought by
Vanzuidam Catherine M and Van Zuidam Walter
Home Financials for this Owner
Home Financials are based on the most recent Mortgage that was taken out on this home.
Original Mortgage
$229,191
Interest Rate
5.01%
Mortgage Type
FHA
Purchase Details
Closed on
Jul 24, 2001
Sold by
Available Not
Bought by
Available Not
Purchase Details
Closed on
Mar 2, 2001
Sold by
Available Not
Bought by
Available Not
Home Financials for this Owner
Home Financials are based on the most recent Mortgage that was taken out on this home.
Original Mortgage
$100,000
Interest Rate
7.01%
Mortgage Type
New Conventional
Purchase Details
Closed on
Aug 1, 1983
Sold by
Available Not
Bought by
Available Not
Similar Home in Lighthouse Point, FL
Create a Home Valuation Report for This Property
The Home Valuation Report is an in-depth analysis detailing your home's value as well as a comparison with similar homes in the area
Home Values in the Area
Average Home Value in this Area
Purchase History
| Date | Type | Sale Price | Title Company |
|---|---|---|---|
| Warranty Deed | $455,000 | Hometown Title Services Inc | |
| Warranty Deed | $313,000 | Title Guaranty Of South Fl I | |
| Warranty Deed | $49,300 | None Available | |
| Warranty Deed | $47,300 | -- | |
| Warranty Deed | $10,000 | -- | |
| Warranty Deed | $50,143 | -- |
Source: Public Records
Mortgage History
| Date | Status | Loan Amount | Loan Type |
|---|---|---|---|
| Open | $432,250 | New Conventional | |
| Previous Owner | $10,000 | Stand Alone Second | |
| Previous Owner | $29,090 | Stand Alone Second | |
| Previous Owner | $229,191 | FHA | |
| Previous Owner | $100,000 | Credit Line Revolving | |
| Previous Owner | $50,000 | Credit Line Revolving | |
| Previous Owner | $100,000 | New Conventional |
Source: Public Records
Property History
| Date | Event | Price | Change | Sq Ft Price |
|---|---|---|---|---|
| 04/02/2021 04/02/21 | Sold | $455,000 | -1.7% | $307 / Sq Ft |
| 02/16/2021 02/16/21 | Price Changed | $463,000 | -2.1% | $312 / Sq Ft |
| 02/05/2021 02/05/21 | Price Changed | $473,000 | +5.2% | $319 / Sq Ft |
| 02/04/2021 02/04/21 | For Sale | $449,500 | -1.2% | $303 / Sq Ft |
| 01/04/2021 01/04/21 | Off Market | $455,000 | -- | -- |
| 12/22/2020 12/22/20 | Price Changed | $449,500 | 0.0% | $303 / Sq Ft |
| 12/22/2020 12/22/20 | For Sale | $449,500 | -1.2% | $303 / Sq Ft |
| 12/15/2020 12/15/20 | Off Market | $455,000 | -- | -- |
| 10/01/2020 10/01/20 | For Sale | $454,900 | 0.0% | $307 / Sq Ft |
| 09/11/2020 09/11/20 | Off Market | $455,000 | -- | -- |
| 09/07/2020 09/07/20 | Price Changed | $454,900 | -0.9% | $307 / Sq Ft |
| 08/26/2020 08/26/20 | For Sale | $459,000 | +57.7% | $309 / Sq Ft |
| 03/10/2020 03/10/20 | Sold | $291,000 | 0.0% | $196 / Sq Ft |
| 12/02/2019 12/02/19 | Off Market | $291,000 | -- | -- |
| 12/02/2019 12/02/19 | Pending | -- | -- | -- |
| 11/17/2019 11/17/19 | Price Changed | $300,000 | -20.0% | $202 / Sq Ft |
| 11/01/2019 11/01/19 | For Sale | $375,000 | -- | $253 / Sq Ft |
Source: MIAMI REALTORS® MLS
Tax History Compared to Growth
Tax History
| Year | Tax Paid | Tax Assessment Tax Assessment Total Assessment is a certain percentage of the fair market value that is determined by local assessors to be the total taxable value of land and additions on the property. | Land | Improvement |
|---|---|---|---|---|
| 2025 | $8,149 | $426,820 | -- | -- |
| 2024 | $7,743 | $414,800 | -- | -- |
| 2023 | $7,743 | $400,690 | $0 | $0 |
| 2022 | $7,139 | $389,020 | $139,040 | $249,980 |
| 2021 | $6,116 | $291,090 | $139,040 | $152,050 |
| 2020 | $6,007 | $329,830 | $139,040 | $190,790 |
| 2019 | $5,993 | $327,980 | $139,040 | $188,940 |
| 2018 | $5,876 | $333,520 | $139,040 | $194,480 |
| 2017 | $6,178 | $308,630 | $0 | $0 |
| 2016 | $3,286 | $187,730 | $0 | $0 |
| 2015 | $2,952 | $186,430 | $0 | $0 |
| 2014 | $2,977 | $184,960 | $0 | $0 |
| 2013 | -- | $194,270 | $74,150 | $120,120 |
Source: Public Records
Agents Affiliated with this Home
-
Seller's Agent in 2021
Asmaa El Kouhen
Brokers, LLC
(305) 469-5476
1 in this area
50 Total Sales
-
N
Buyer's Agent in 2021
Non-Member Mls Agent
-
Seller's Agent in 2020
Durel Jones
Breo Realty LLC
(786) 271-3464
29 Total Sales
Map
Source: MIAMI REALTORS® MLS
MLS Number: A10771734
APN: 48-43-19-08-0010
Disclaimer: Certain information contained herein is derived from information provided by parties other than Homes.com. All information provided is deemed reliable, but is not guaranteed to be accurate and should be independently verified.
![]() IDX information is provided exclusively for personal, non-commercial use, and may not be used for any purpose other than to identify prospective properties consumers may be interested in purchasing. Information is deemed reliable but not guaranteed.
IDX information is provided exclusively for personal, non-commercial use, and may not be used for any purpose other than to identify prospective properties consumers may be interested in purchasing. Information is deemed reliable but not guaranteed.
Nearby Homes
- 2111 NE 35th St
- 2130 NE 36th St Unit 63
- 2130 NE 36th St Unit 66
- 2162 NE 36th St Unit 46
- 2202 NE 36th St Unit 15
- 2160 NE 36th St Unit 40
- 2160 NE 36th St Unit 36
- 2120 NE 34th Ct
- 1990 NE 35th St
- 2020 NE 34th Ct
- 3401 NE 21st Ave
- 2211 NE 34th Ct
- 2100 NE 38th St Unit 216
- 2100 NE 38th St Unit 141
- 2100 NE 38th St Unit 128
- 2100 NE 38th St Unit 217
- 2100 NE 38th St Unit 114
- 2100 NE 38th St Unit 135
- 2100 NE 38th St Unit 236
- 2010 NE 33rd St