2101 Pear Tree Ln Durham, NC 27703
South Durham NeighborhoodEstimated Value: $469,000 - $521,876
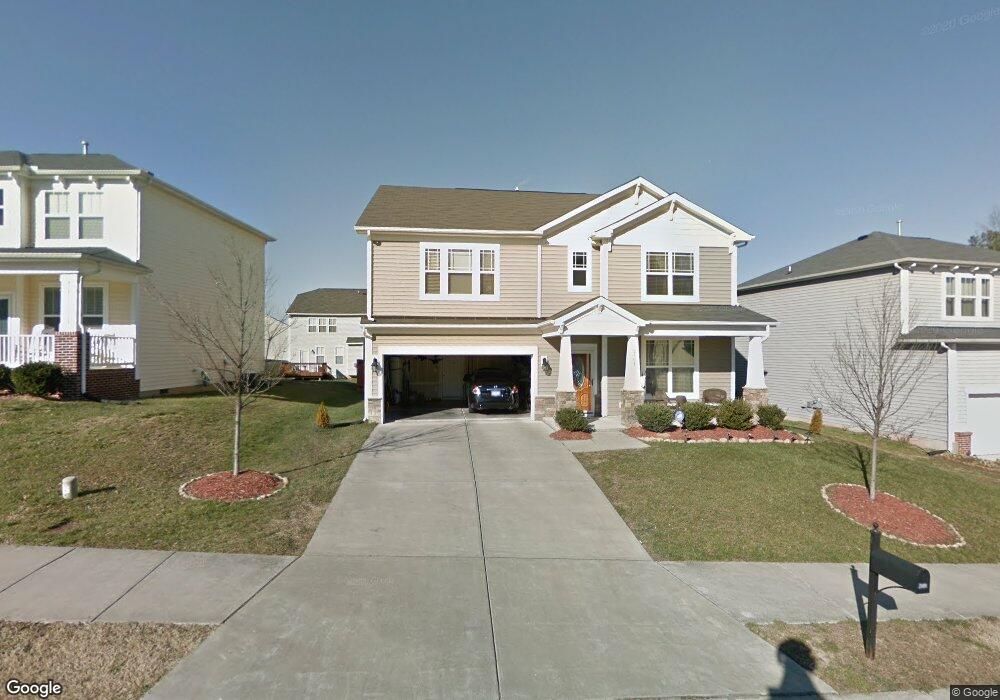
About This Home
This home is located at 2101 Pear Tree Ln, Durham, NC 27703 and is currently estimated at $490,719, approximately $160 per square foot. 2101 Pear Tree Ln is a home located in Durham County with nearby schools including R.N. Harris Elementary School, James E. Shepard Middle School, and Hillside High School.
Ownership History
We collect this data history from publicly available records. To have your information removed, we recommend requesting removal directly through your county’s website.
Purchase Details
Home Financials for this Owner
Home Financials are based on the most recent Mortgage that was taken out on this home.Purchase Details
Home Financials for this Owner
Home Financials are based on the most recent Mortgage that was taken out on this home.Home Values in the Area
Average Home Value in this Area
Purchase History
We collect this data history from publicly available records. To have your information removed, we recommend requesting removal directly through your county’s website.
| Date | Buyer | Sale Price | Title Company |
|---|---|---|---|
| $370,000 | None Available | ||
| $219,500 | None Available |
Mortgage History
We collect this data history from publicly available records. To have your information removed, we recommend requesting removal directly through your county’s website.
| Date | Status | Borrower | Loan Amount |
|---|---|---|---|
| Open | $357,651 | ||
| Previous Owner | $213,467 |
Tax History
We collect this data history from publicly available records. To have your information removed, we recommend requesting removal directly through your county’s website.
| Year | Tax Paid | Tax Assessment Tax Assessment Total Assessment is a certain percentage of the fair market value that is determined by local assessors to be the total taxable value of land and additions on the property. | Land | Improvement |
|---|---|---|---|---|
| 2025 | $5,310 | $535,610 | $86,250 | $449,360 |
| 2024 | $4,187 | $300,135 | $48,747 | $251,388 |
| 2023 | $3,931 | $300,135 | $48,747 | $251,388 |
| 2022 | $3,841 | $300,135 | $48,747 | $251,388 |
| 2021 | $3,823 | $300,135 | $48,747 | $251,388 |
| 2020 | $3,733 | $300,135 | $48,747 | $251,388 |
| 2019 | $3,733 | $300,135 | $48,747 | $251,388 |
| 2018 | $3,760 | $277,167 | $40,145 | $237,022 |
| 2017 | $3,732 | $277,167 | $40,145 | $237,022 |
| 2016 | $3,606 | $277,167 | $40,145 | $237,022 |
| 2015 | $3,079 | $222,440 | $44,846 | $177,594 |
| 2014 | $3,079 | $222,440 | $44,846 | $177,594 |
Map
- 2106 Pear Tree Ln
- 1815 Rustica Dr
- 209 Maple Walk St
- 308 Garden Walk Dr
- 2025 So-Hi Dr
- 2011 Magnolia Tree Ln
- 108 Zante Currant Rd
- 109 Conway Dr
- 125 Churment Ct
- 3005 Courtney Creek Blvd
- 2458 S Alston Ave
- 1674 Snowmass Way
- 2717 Wyntercrest Ln
- 1218 Helms St
- 1222 Helms St
- 1220 Helms St
- 1224 Helms St
- 1226 Helms St
- 1311 Holly Grove Way
- 2728 Wyntercrest Ln
- 2108 Pear Tree Ln
- 2104 Pear Tree Ln
- 2110 Pear Tree Ln
- 1 White Spruce Ct
- 2107 Pear Tree Ln
- 2103 Pear Tree Ln
- 3 White Spruce Ct
- 2109 Pear Tree Ln
- 2201 Pear Tree Ln
- 5 White Spruce Ct
- 18 Elm Tree Ct
- 2005 Pear Tree Ln
- 2205 Pear Tree Ln
- 14 Elm Tree Ct
- 2710 Enfield Dr
- 10 Elm Tree Ct
- 22 Elm Tree Ct
- 2 White Spruce Ct
- 6 Elm Tree Ct
- 4 White Spruce Ct
Ask me questions while you tour the home.