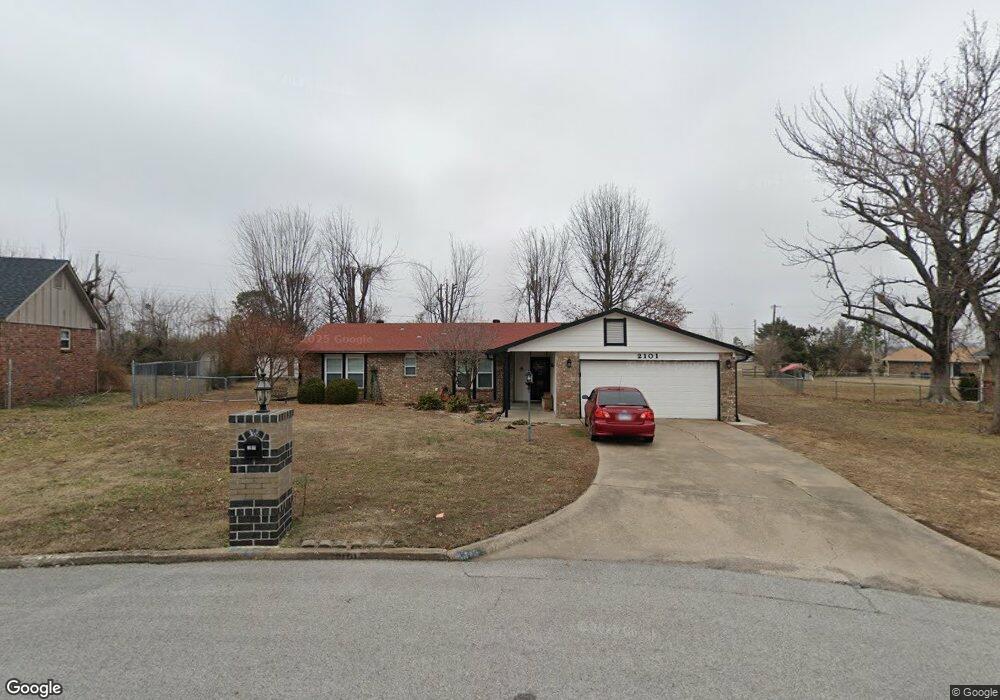
2101 Redbud St Rogers, AR 72758
Estimated Value: $303,293 - $371,000
--
Bed
2
Baths
1,475
Sq Ft
$219/Sq Ft
Est. Value
About This Home
This home is located at 2101 Redbud St, Rogers, AR 72758 and is currently estimated at $323,073, approximately $219 per square foot. 2101 Redbud St is a home located in Benton County with nearby schools including Westside Elementary School, Oakdale Middle School, and Rogers Heritage High School.
Ownership History
Date
Name
Owned For
Owner Type
Purchase Details
Closed on
Apr 22, 2024
Sold by
Ferman Doris N and Cruz Santos
Bought by
Fuentes Jose C Santos and Fuentes Idalia Dela Cruz Re
Current Estimated Value
Purchase Details
Closed on
Aug 4, 2017
Sold by
Bouma Carol Ann and Bouma Jay Edward
Bought by
Ferman Doris N
Home Financials for this Owner
Home Financials are based on the most recent Mortgage that was taken out on this home.
Original Mortgage
$104,800
Interest Rate
4.03%
Purchase Details
Closed on
Mar 19, 2010
Sold by
Bouma Carol Ann and Bouma Jay Edward
Bought by
Bouma Carol Ann and Bouma Jay Edward
Purchase Details
Closed on
Dec 10, 2001
Bought by
Dod 12-10-2001
Purchase Details
Closed on
Aug 15, 1971
Bought by
Bates
Create a Home Valuation Report for This Property
The Home Valuation Report is an in-depth analysis detailing your home's value as well as a comparison with similar homes in the area
Home Values in the Area
Average Home Value in this Area
Purchase History
| Date | Buyer | Sale Price | Title Company |
|---|---|---|---|
| Fuentes Jose C Santos | -- | None Listed On Document | |
| Ferman Doris N | $131,000 | None Available | |
| Bouma Carol Ann | $1,000 | None Available | |
| Dod 12-10-2001 | -- | -- | |
| Bates | $25,000 | -- |
Source: Public Records
Mortgage History
| Date | Status | Borrower | Loan Amount |
|---|---|---|---|
| Previous Owner | Ferman Doris N | $104,800 |
Source: Public Records
Tax History Compared to Growth
Tax History
| Year | Tax Paid | Tax Assessment Tax Assessment Total Assessment is a certain percentage of the fair market value that is determined by local assessors to be the total taxable value of land and additions on the property. | Land | Improvement |
|---|---|---|---|---|
| 2025 | $1,938 | $51,729 | $19,000 | $32,729 |
| 2024 | $1,734 | $51,729 | $19,000 | $32,729 |
| 2023 | $1,576 | $33,360 | $8,000 | $25,360 |
| 2022 | $1,513 | $33,360 | $8,000 | $25,360 |
| 2021 | $1,383 | $33,360 | $8,000 | $25,360 |
| 2020 | $1,258 | $22,920 | $4,600 | $18,320 |
| 2019 | $1,258 | $22,920 | $4,600 | $18,320 |
| 2018 | $1,258 | $22,920 | $4,600 | $18,320 |
| 2017 | $535 | $22,920 | $4,600 | $18,320 |
| 2016 | $535 | $22,920 | $4,600 | $18,320 |
| 2015 | $902 | $20,680 | $5,000 | $15,680 |
| 2014 | $552 | $20,680 | $5,000 | $15,680 |
Source: Public Records
Map
Nearby Homes
- 2104 W Oak St
- 2202 W Oak St
- 2001 & 2003 W Sycamore St
- 2308 W Willow St
- 825 S 23rd St
- 902 S 17th St
- 1012 S 19th St
- 2309 & 2311 W Pecan St
- 1807 W Cypress St
- 910 S 16th St
- 1905 W Countryside Ln
- 1903 Countryside Ln
- 1501 Countryside Cir
- 917 S 15th St
- 1604 S 23rd St
- 916 S 25th Place
- 2432 & 2434 W Magnolia St
- 2503 W Oak St
- 1600 S 23rd Place
- 1611 S Beth Dr