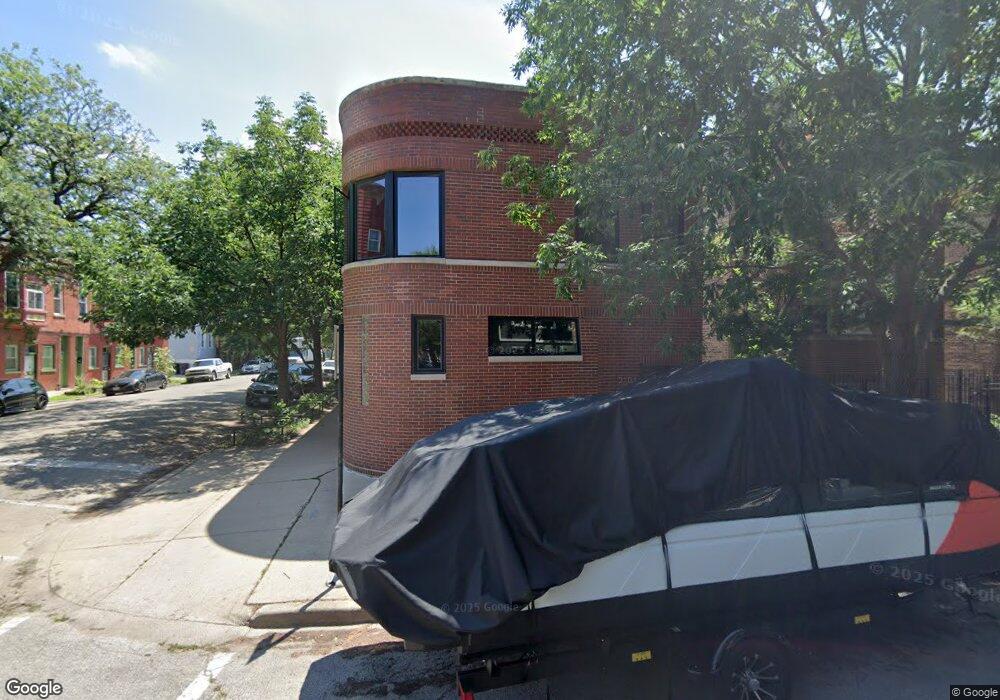
2101 W Huron St Chicago, IL 60612
West Town NeighborhoodEstimated Value: $1,295,039 - $1,586,000
4
Beds
3
Baths
2,990
Sq Ft
$472/Sq Ft
Est. Value
About This Home
This home is located at 2101 W Huron St, Chicago, IL 60612 and is currently estimated at $1,412,510, approximately $472 per square foot. 2101 W Huron St is a home located in Cook County with nearby schools including Mitchell Elementary School, Wells Community Academy High School, and St Nicholas Cathedral.
Ownership History
Date
Name
Owned For
Owner Type
Purchase Details
Closed on
Nov 15, 2023
Sold by
Heibel Tara M
Bought by
Tara Heibel Revocable Trust and Heibel
Current Estimated Value
Purchase Details
Closed on
Jan 19, 2005
Sold by
Wilmot Eric A and Heibel Tara
Bought by
Heibel Tara M
Purchase Details
Closed on
Sep 21, 2004
Sold by
Wilmot Eric A
Bought by
Wilmot Eric A and Heibel Tara M
Purchase Details
Closed on
Jan 24, 2004
Sold by
Heibel Tara M
Bought by
Wilmot Eric A
Home Financials for this Owner
Home Financials are based on the most recent Mortgage that was taken out on this home.
Original Mortgage
$95,000
Interest Rate
4.62%
Mortgage Type
Unknown
Purchase Details
Closed on
Jun 13, 2000
Sold by
Alvarez Jose S
Bought by
Heibel Tara and Wilmot Eric
Purchase Details
Closed on
Jul 23, 1986
Sold by
Alvarez Gloria
Bought by
Alvarez Jose S
Create a Home Valuation Report for This Property
The Home Valuation Report is an in-depth analysis detailing your home's value as well as a comparison with similar homes in the area
Home Values in the Area
Average Home Value in this Area
Purchase History
| Date | Buyer | Sale Price | Title Company |
|---|---|---|---|
| Tara Heibel Revocable Trust | -- | None Listed On Document | |
| Heibel Tara M | -- | -- | |
| Wilmot Eric A | -- | -- | |
| Wilmot Eric A | -- | 1St American Title | |
| Heibel Tara | $280,000 | -- | |
| Alvarez Jose S | -- | -- |
Source: Public Records
Mortgage History
| Date | Status | Borrower | Loan Amount |
|---|---|---|---|
| Previous Owner | Wilmot Eric A | $95,000 |
Source: Public Records
Tax History Compared to Growth
Tax History
| Year | Tax Paid | Tax Assessment Tax Assessment Total Assessment is a certain percentage of the fair market value that is determined by local assessors to be the total taxable value of land and additions on the property. | Land | Improvement |
|---|---|---|---|---|
| 2024 | $18,768 | $129,000 | $28,347 | $100,653 |
| 2023 | $18,219 | $92,000 | $22,830 | $69,170 |
| 2022 | $18,219 | $92,000 | $22,830 | $69,170 |
| 2021 | $17,831 | $92,000 | $22,830 | $69,170 |
| 2020 | $16,686 | $78,005 | $12,937 | $65,068 |
| 2019 | $16,533 | $85,720 | $12,937 | $72,783 |
| 2018 | $16,254 | $85,720 | $12,937 | $72,783 |
| 2017 | $10,322 | $51,323 | $11,415 | $39,908 |
| 2016 | $9,779 | $51,323 | $11,415 | $39,908 |
| 2015 | $8,924 | $51,323 | $11,415 | $39,908 |
| 2014 | $8,373 | $47,699 | $9,512 | $38,187 |
| 2013 | $8,197 | $47,699 | $9,512 | $38,187 |
Source: Public Records
Map
Nearby Homes
- 2127 W Huron St
- 2149 W Huron St
- 1609 W Superior St
- 2059 W Erie St
- 2036 W Erie St
- 2044 W Superior St
- 2200 W Erie St Unit A
- 2203 W Huron St
- 2138 W Ohio St Unit 3
- 2209 W Erie St
- 2002 W Huron St
- 2002 W Ohio St
- 2101 W Rice St Unit 402
- 2059 W Race Ave
- 2055 W Race Ave
- 2053 W Race Ave
- 2049 W Race Ave
- 2245 W Erie St
- 2035 W Race Ave
- 518 N Leavitt St Unit 3
- 2105 W Huron St Unit 1
- 2105 W Huron St Unit 2
- 2105 W Huron St
- 2105 W Huron St
- 2107 W Huron St
- 2107 W Huron St Unit G
- 2107 W Huron St
- 2107 W Huron St Unit 1
- 2111 W Huron St
- 2057 W Huron St
- 2059 W Huron St Unit 2
- 2115 W Huron St
- 2115 W Huron St Unit G
- 2055 W Huron St
- 708 N Hoyne Ave Unit 3
- 708 N Hoyne Ave Unit 4
- 708 N Hoyne Ave Unit 2
- 2102 W Huron St Unit 3
- 2102 W Huron St Unit 1
- 2106 W Erie St Unit 3E