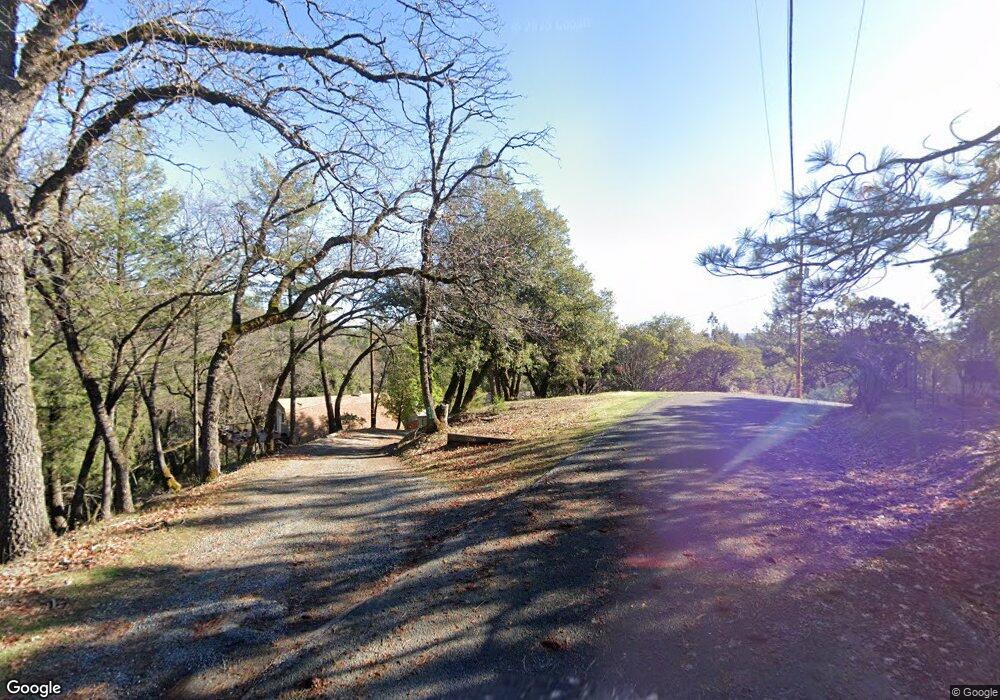
21010 Suncrest Dr Colfax, CA 95713
Estimated Value: $456,000 - $515,738
2
Beds
2
Baths
1,680
Sq Ft
$292/Sq Ft
Est. Value
About This Home
This home is located at 21010 Suncrest Dr, Colfax, CA 95713 and is currently estimated at $490,185, approximately $291 per square foot. 21010 Suncrest Dr is a home located in Placer County with nearby schools including Weimar Hills, Sierra Hills Elementary School, and Colfax High School.
Ownership History
Date
Name
Owned For
Owner Type
Purchase Details
Closed on
Feb 3, 2021
Sold by
Kirkpatrick Donna
Bought by
Kirkpatrick Donna Lee and The Donna Lee Kirkpatrick Livi
Current Estimated Value
Purchase Details
Closed on
Jun 7, 2007
Sold by
Kirkpatrick Helen C
Bought by
Kirkpatrick Donna L
Home Financials for this Owner
Home Financials are based on the most recent Mortgage that was taken out on this home.
Original Mortgage
$235,480
Outstanding Balance
$146,569
Interest Rate
6.51%
Mortgage Type
FHA
Estimated Equity
$343,616
Purchase Details
Closed on
Apr 14, 1998
Sold by
Kirkpatrick Donna L and Kirkpatrick Helen C
Bought by
Kirkpatrick Donna L and Kirkpatrick Helen C
Home Financials for this Owner
Home Financials are based on the most recent Mortgage that was taken out on this home.
Original Mortgage
$120,000
Interest Rate
7.06%
Mortgage Type
Purchase Money Mortgage
Purchase Details
Closed on
Sep 26, 1996
Sold by
Kirkpatrick Donna L
Bought by
Kirkpatrick Donna L
Create a Home Valuation Report for This Property
The Home Valuation Report is an in-depth analysis detailing your home's value as well as a comparison with similar homes in the area
Home Values in the Area
Average Home Value in this Area
Purchase History
| Date | Buyer | Sale Price | Title Company |
|---|---|---|---|
| Kirkpatrick Donna Lee | -- | None Available | |
| Kirkpatrick Donna L | -- | First American Title | |
| Kirkpatrick Donna L | -- | Old Republic Title Company | |
| Kirkpatrick Donna L | -- | Placer Title Company |
Source: Public Records
Mortgage History
| Date | Status | Borrower | Loan Amount |
|---|---|---|---|
| Open | Kirkpatrick Donna L | $235,480 | |
| Previous Owner | Kirkpatrick Donna L | $120,000 |
Source: Public Records
Tax History
| Year | Tax Paid | Tax Assessment Tax Assessment Total Assessment is a certain percentage of the fair market value that is determined by local assessors to be the total taxable value of land and additions on the property. | Land | Improvement |
|---|---|---|---|---|
| 2025 | $2,882 | $249,785 | $144,988 | $104,797 |
| 2023 | $2,882 | $240,088 | $139,359 | $100,729 |
| 2022 | $2,772 | $235,381 | $136,627 | $98,754 |
| 2021 | $2,706 | $230,767 | $133,949 | $96,818 |
| 2020 | $2,666 | $228,402 | $132,576 | $95,826 |
| 2019 | $2,610 | $223,925 | $129,977 | $93,948 |
| 2018 | $2,339 | $219,535 | $127,429 | $92,106 |
| 2017 | $2,294 | $215,231 | $124,931 | $90,300 |
| 2016 | $2,242 | $211,012 | $122,482 | $88,530 |
| 2015 | $2,187 | $207,844 | $120,643 | $87,201 |
| 2014 | $2,152 | $203,773 | $118,280 | $85,493 |
Source: Public Records
Map
Nearby Homes
- 0 Forest Lake Place Unit 226017031
- 0 Forest Lake Place Unit 226016409
- 0 Forest Lake Place Unit 226017447
- 1890 John Muir Dr
- 1355 E Weimar Cross Rd
- 870 Swanson Ln
- 525 Deerborne Ct
- 20335 Montana Ln
- 20920 Sunset Way
- 2000 Ponderosa Way
- 1500 Live Oak Rd
- 219 Hinchey Ln
- 135 Ponderosa Way Unit 14
- 135 Ponderosa Way Unit 30
- 135 Ponderosa Way Unit 2
- 19740 Wedemeyer Place
- 21895 One Fine Place
- 22500 Canyon Way
- 0 Natures Way
- 620 Sundance Place
- 21001 Suncrest Dr
- 20930 Suncrest Dr
- 21023 Suncrest Dr
- 21100 Suncrest Dr
- 21091 Dawnridge Dr S
- 21065 Dawnridge Dr S
- 21145 Dawnridge Dr S
- 20900 Suncrest Dr
- 21071 Suncrest Dr
- 21090 Dawn Ridge Dr S
- 21160 Suncrest Dr
- 21150 Dawnridge Dr S
- 21020 Dawnridge Dr S
- 1441 Swanson Ln
- 1315 Swanson Ln
- 21281 Dawnridge Dr S
- 21215 Dawnridge Dr S
- 21050 Dawnridge Dr S
- 21045 Forest Lake Place
- 21171 Suncrest Dr
Your Personal Tour Guide
Ask me questions while you tour the home.