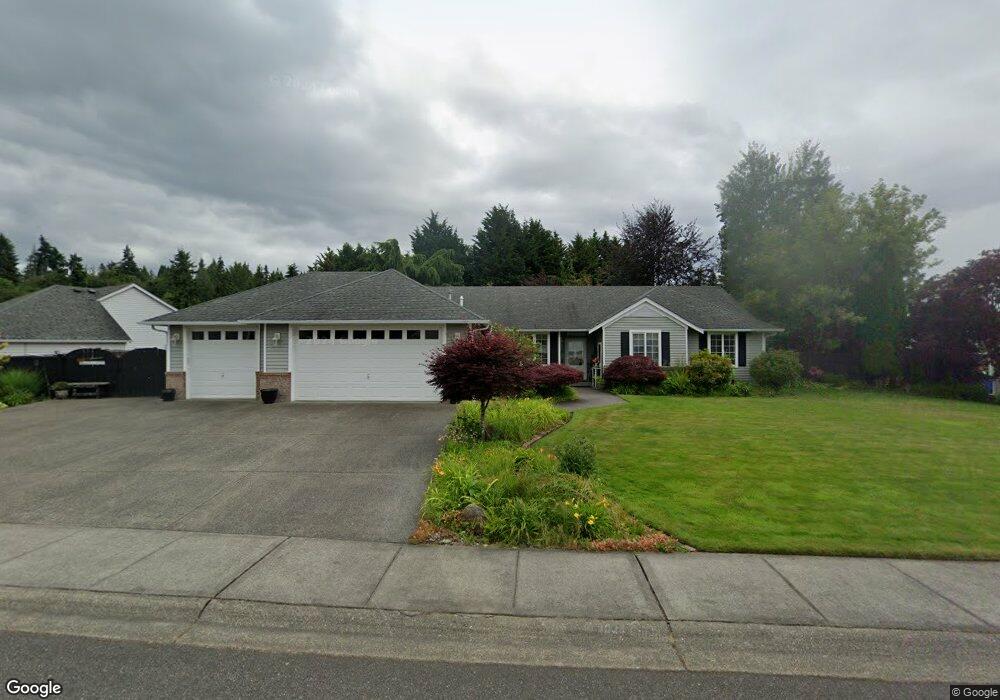
21012 111th Avenue Ct E Graham, WA 98338
Estimated Value: $582,660 - $641,000
3
Beds
3
Baths
1,991
Sq Ft
$306/Sq Ft
Est. Value
About This Home
This home is located at 21012 111th Avenue Ct E, Graham, WA 98338 and is currently estimated at $609,915, approximately $306 per square foot. 21012 111th Avenue Ct E is a home located in Pierce County with nearby schools including Nelson Elementary School, Frontier Middle School, and Graham Kapowsin High School.
Ownership History
Date
Name
Owned For
Owner Type
Purchase Details
Closed on
Nov 30, 2005
Sold by
Barron Floyd A and Barron Shirley A
Bought by
Hoime Thomas E and Hoime Carole A
Current Estimated Value
Home Financials for this Owner
Home Financials are based on the most recent Mortgage that was taken out on this home.
Original Mortgage
$241,600
Outstanding Balance
$133,808
Interest Rate
6.12%
Mortgage Type
Fannie Mae Freddie Mac
Estimated Equity
$476,107
Purchase Details
Closed on
Sep 24, 2003
Sold by
Bushaw Douglas J
Bought by
Barron Floyd A and Barron Shirley A
Home Financials for this Owner
Home Financials are based on the most recent Mortgage that was taken out on this home.
Original Mortgage
$211,840
Interest Rate
6.17%
Mortgage Type
Purchase Money Mortgage
Purchase Details
Closed on
May 31, 2001
Sold by
Boardwalk Homes Inc
Bought by
Bushaw Douglas J and Bushaw Roxanne M
Home Financials for this Owner
Home Financials are based on the most recent Mortgage that was taken out on this home.
Original Mortgage
$179,100
Interest Rate
7.15%
Create a Home Valuation Report for This Property
The Home Valuation Report is an in-depth analysis detailing your home's value as well as a comparison with similar homes in the area
Home Values in the Area
Average Home Value in this Area
Purchase History
| Date | Buyer | Sale Price | Title Company |
|---|---|---|---|
| Hoime Thomas E | $302,000 | Chicago Title Insurance Co | |
| Barron Floyd A | $264,800 | Transnation Title Ins Co | |
| Bushaw Douglas J | $223,613 | Chicago Title Insurance Comp |
Source: Public Records
Mortgage History
| Date | Status | Borrower | Loan Amount |
|---|---|---|---|
| Open | Hoime Thomas E | $241,600 | |
| Previous Owner | Barron Floyd A | $211,840 | |
| Previous Owner | Bushaw Douglas J | $179,100 | |
| Closed | Bushaw Douglas J | $33,500 | |
| Closed | Barron Floyd A | $26,480 |
Source: Public Records
Tax History Compared to Growth
Tax History
| Year | Tax Paid | Tax Assessment Tax Assessment Total Assessment is a certain percentage of the fair market value that is determined by local assessors to be the total taxable value of land and additions on the property. | Land | Improvement |
|---|---|---|---|---|
| 2025 | $5,833 | $543,900 | $185,400 | $358,500 |
| 2024 | $5,833 | $525,500 | $185,400 | $340,100 |
| 2023 | $5,833 | $497,800 | $192,500 | $305,300 |
| 2022 | $5,463 | $517,300 | $182,500 | $334,800 |
| 2021 | $4,961 | $351,500 | $118,700 | $232,800 |
| 2019 | $4,012 | $348,600 | $102,200 | $246,400 |
| 2018 | $4,383 | $320,200 | $85,700 | $234,500 |
| 2017 | $4,249 | $279,900 | $67,600 | $212,300 |
| 2016 | $3,851 | $245,100 | $45,800 | $199,300 |
| 2014 | $3,403 | $227,100 | $45,800 | $181,300 |
| 2013 | $3,403 | $207,800 | $43,200 | $164,600 |
Source: Public Records
Map
Nearby Homes
- 11107 212th St E
- 11220 212th St E
- 20810 115th Avenue Ct E
- 11305 207th St E
- 20216 110th Avenue Ct E
- 20119 112th Ave E
- 10010 219th Street Ct E
- 22006 Meridian (Lot 2) E
- 22010 Meridian (Lot 3) E
- 22010 Meridian Ave E
- 214th 256th St E
- 10525 197th Street Ct E Unit 51
- 19916 119th Avenue Ct E
- 20412 97th Avenue Ct E Unit 3
- 10609 197th St E
- 9822 201st St E
- 20715 95th Avenue Ct E
- 9705 205th St E Unit 29
- 20432 97th Ave E Unit 8
- 20404 97th Ave E
- 21022 111th Avenue Ct E
- 21013 111th Ave E
- 21013 111th Ave E
- 21009 111th Ave E
- 21009 111th Ave E
- 21017 111th Ave E
- 21017 111th Ave E
- 21013 111th Avenue Ct E
- 21017 111th Avenue Ct E
- 21025 111th Avenue Ct E
- 21009 111th Avenue Ct E
- 21021 111th Avenue Ct E
- 21005 111th Ave E
- 21021 111th Ave E
- 21021 111th Ave E
- 21005 111th Avenue Ct E
- 11026 Eustis Hunt Rd E
- 21010 111th Ave E
- 21006 111th Ave E