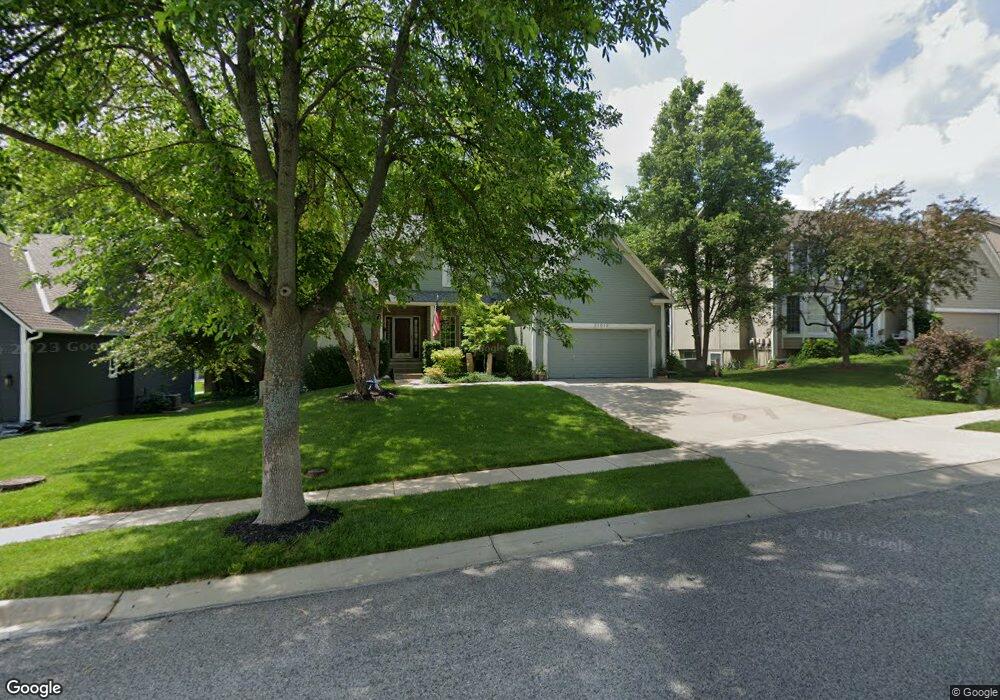
21019 W 98th St Lenexa, KS 66220
Estimated Value: $458,000 - $552,000
4
Beds
3
Baths
2,695
Sq Ft
$187/Sq Ft
Est. Value
About This Home
This home is located at 21019 W 98th St, Lenexa, KS 66220 and is currently estimated at $503,582, approximately $186 per square foot. 21019 W 98th St is a home located in Johnson County with nearby schools including Manchester Park Elementary School, Prairie Trail Middle School, and Olathe Northwest High School.
Ownership History
Date
Name
Owned For
Owner Type
Purchase Details
Closed on
Jun 10, 2009
Sold by
Kendall Eric E and Kendall Sheri L
Bought by
Kendall Eric E and Kendall Sheri L
Current Estimated Value
Home Financials for this Owner
Home Financials are based on the most recent Mortgage that was taken out on this home.
Original Mortgage
$164,664
Outstanding Balance
$103,644
Interest Rate
4.7%
Mortgage Type
New Conventional
Estimated Equity
$399,938
Purchase Details
Closed on
Jul 6, 2001
Sold by
Dahle Steven K and Dahle Rita L
Bought by
Kendall Eric E and Smith Sheri L
Home Financials for this Owner
Home Financials are based on the most recent Mortgage that was taken out on this home.
Original Mortgage
$159,000
Interest Rate
7.18%
Create a Home Valuation Report for This Property
The Home Valuation Report is an in-depth analysis detailing your home's value as well as a comparison with similar homes in the area
Home Values in the Area
Average Home Value in this Area
Purchase History
| Date | Buyer | Sale Price | Title Company |
|---|---|---|---|
| Kendall Eric E | -- | Chicago Title Insurance Co | |
| Kendall Eric E | -- | Chicago Title Insurance Co |
Source: Public Records
Mortgage History
| Date | Status | Borrower | Loan Amount |
|---|---|---|---|
| Open | Kendall Eric E | $164,664 | |
| Closed | Kendall Eric E | $159,000 |
Source: Public Records
Tax History Compared to Growth
Tax History
| Year | Tax Paid | Tax Assessment Tax Assessment Total Assessment is a certain percentage of the fair market value that is determined by local assessors to be the total taxable value of land and additions on the property. | Land | Improvement |
|---|---|---|---|---|
| 2024 | $5,238 | $42,768 | $8,351 | $34,417 |
| 2023 | $5,468 | $43,654 | $7,957 | $35,697 |
| 2022 | $5,130 | $39,928 | $7,575 | $32,353 |
| 2021 | $4,914 | $36,305 | $7,215 | $29,090 |
| 2020 | $4,842 | $35,431 | $7,215 | $28,216 |
| 2019 | $4,669 | $33,891 | $6,010 | $27,881 |
| 2018 | $4,433 | $31,809 | $6,010 | $25,799 |
| 2017 | $4,392 | $30,831 | $5,459 | $25,372 |
| 2016 | $4,035 | $28,945 | $5,459 | $23,486 |
| 2015 | $4,136 | $29,693 | $5,460 | $24,233 |
| 2013 | -- | $25,656 | $5,460 | $20,196 |
Source: Public Records
Map
Nearby Homes
- 22003 W 100th Terrace
- 9705 Sunset Cir
- 20516 W 98th Place
- 20914 W 96th Terrace
- 21522 W 98th Terrace
- 21123 W 95th Terrace
- 21111 W 95th Terrace
- 22076 W 99th Terrace
- 21901 W 99th Terrace
- 22005 W 99th Terrace
- 22077 W 99th Terrace
- 22017 W 99th Terrace
- 22029 W 99th Terrace
- 9450 Marion St
- 20802 W 102nd St
- 10206 Theden Cir
- 9917 Fountain Cir
- 20825 W 94th Terrace
- 21913 W 99th Terrace
- 21925 W 99th Terrace
- 21023 W 98th St
- 21015 W 98th St
- 21000 W 99th St
- 21004 W 99th St
- 21101 W 98th St
- 20924 W 99th St
- 21022 W 98th St
- 21011 W 98th St
- 21107 W 98th St
- 20922 W 99th St
- 21100 W 98th St
- 21106 W 98th St
- 9902 Woodstock St
- 21113 W 98th St
- 9901 Woodstock St
- 20920 W 99th St
- 21112 W 98th St
- 21119 W 98th St
- 9906 Woodstock St
- 9905 Woodstock St