Estimated Value: $257,000 - $358,000
About This Home
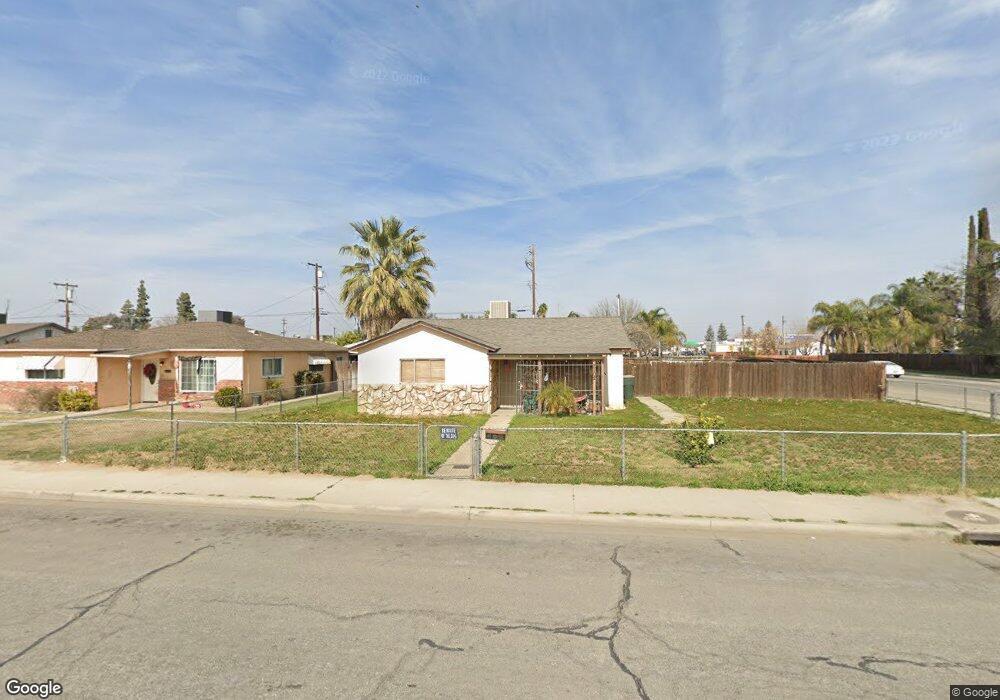
This home is located at 2102 2nd St, Wasco, CA 93280 and is currently estimated at $314,342, approximately $269 per square foot. 2102 2nd St is a home located in Kern County with nearby schools including John L. Prueitt Elementary School, Thomas Jefferson Middle School, and Wasco High School.
Ownership History
We collect this data history from publicly available records. To have your information removed, we recommend requesting removal directly through your county’s website.
Purchase Details
Purchase Details
Purchase Details
Purchase Details
Home Values in the Area
Average Home Value in this Area
Purchase History
We collect this data history from publicly available records. To have your information removed, we recommend requesting removal directly through your county’s website.
| Date | Buyer | Sale Price | Title Company |
|---|---|---|---|
| -- | None Available | ||
| $70,000 | None Available | ||
| -- | None Available | ||
| -- | None Available |
Tax History
We collect this data history from publicly available records. To have your information removed, we recommend requesting removal directly through your county’s website.
| Year | Tax Paid | Tax Assessment Tax Assessment Total Assessment is a certain percentage of the fair market value that is determined by local assessors to be the total taxable value of land and additions on the property. | Land | Improvement |
|---|---|---|---|---|
| 2025 | $2,396 | $189,886 | $36,051 | $153,835 |
| 2024 | $2,330 | $186,164 | $35,345 | $150,819 |
| 2023 | $2,330 | $182,514 | $34,652 | $147,862 |
| 2022 | $2,254 | $178,936 | $33,973 | $144,963 |
| 2021 | $2,171 | $175,428 | $33,307 | $142,121 |
| 2020 | $2,171 | $173,630 | $32,966 | $140,664 |
| 2019 | $2,096 | $173,630 | $32,966 | $140,664 |
| 2018 | $2,105 | $166,889 | $31,687 | $135,202 |
| 2017 | $2,052 | $163,617 | $31,066 | $132,551 |
| 2016 | $1,871 | $160,409 | $30,457 | $129,952 |
| 2015 | $1,835 | $158,000 | $30,000 | $128,000 |
| 2014 | $1,106 | $91,970 | $20,902 | $71,068 |
Map
- 2409 Alpine Meadow Ct
- 1903 Penelope Ave
- 1622 6th St
- 1780 Ironbark St
- 625 Cedar Ave
- 2326 Sycamore St
- 2418 Sycamore St
- 791 Redwood Ave
- 2324 2324 9th St
- 318 Adams St
- Lot #163 Track #1226
- 1065 1st St
- 374 Broadway St
- 1009 Rosewood Ave
- 1000 1st St
- 911 Oleander Ct
- 342 C St
- 1030 5th Place
- 1001 Cedar Ave
- 1016 Iris St
Ask me questions while you tour the home.