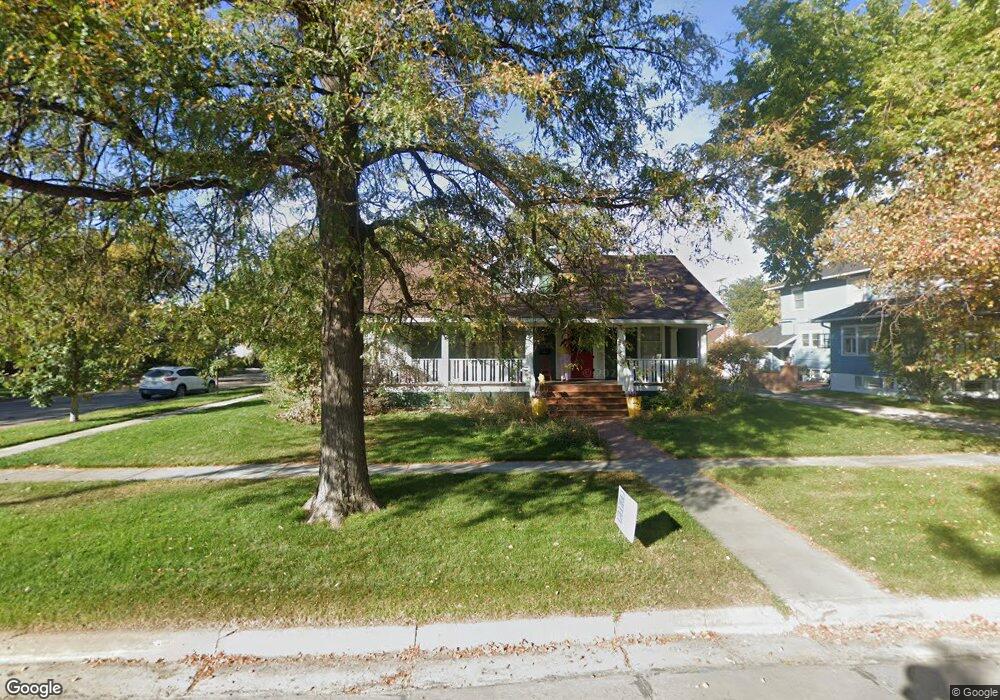
2102 3rd Ave Scottsbluff, NE 69361
Estimated Value: $372,000 - $396,000
4
Beds
3
Baths
2,632
Sq Ft
$147/Sq Ft
Est. Value
About This Home
This home is located at 2102 3rd Ave, Scottsbluff, NE 69361 and is currently estimated at $386,171, approximately $146 per square foot. 2102 3rd Ave is a home located in Scotts Bluff County with nearby schools including Longfellow Elementary School, Bluffs Middle School, and Scottsbluff Senior High School.
Ownership History
Date
Name
Owned For
Owner Type
Purchase Details
Closed on
Jun 18, 2021
Sold by
Elvehjem Matthew A and Elvehjem Tressa K
Bought by
Depeyer Daniel and De Peyer Jacqueline
Current Estimated Value
Home Financials for this Owner
Home Financials are based on the most recent Mortgage that was taken out on this home.
Original Mortgage
$284,525
Outstanding Balance
$256,477
Interest Rate
2.9%
Mortgage Type
New Conventional
Estimated Equity
$129,694
Purchase Details
Closed on
Jul 15, 2015
Sold by
Kent Louise A and Kent Douglas H
Bought by
Elvehjem Matthew A and Elvehjem Tressa K
Home Financials for this Owner
Home Financials are based on the most recent Mortgage that was taken out on this home.
Original Mortgage
$200,000
Interest Rate
3.54%
Mortgage Type
New Conventional
Create a Home Valuation Report for This Property
The Home Valuation Report is an in-depth analysis detailing your home's value as well as a comparison with similar homes in the area
Home Values in the Area
Average Home Value in this Area
Purchase History
| Date | Buyer | Sale Price | Title Company |
|---|---|---|---|
| Depeyer Daniel | $300,000 | Ferguson Title Services Llc | |
| Elvehjem Matthew A | $250,000 | Western Prairie Title Co |
Source: Public Records
Mortgage History
| Date | Status | Borrower | Loan Amount |
|---|---|---|---|
| Open | Depeyer Daniel | $284,525 | |
| Previous Owner | Elvehjem Matthew A | $200,000 |
Source: Public Records
Tax History
| Year | Tax Paid | Tax Assessment Tax Assessment Total Assessment is a certain percentage of the fair market value that is determined by local assessors to be the total taxable value of land and additions on the property. | Land | Improvement |
|---|---|---|---|---|
| 2025 | $4,253 | $352,845 | $28,000 | $324,845 |
| 2024 | $4,246 | $337,375 | $28,000 | $309,375 |
| 2023 | $5,433 | $268,260 | $25,900 | $242,360 |
| 2022 | $5,433 | $268,260 | $25,900 | $242,360 |
| 2021 | $5,008 | $243,658 | $25,900 | $217,758 |
| 2020 | $4,866 | $235,283 | $25,900 | $209,383 |
| 2019 | $4,733 | $229,184 | $25,900 | $203,284 |
| 2018 | $4,486 | $215,885 | $25,900 | $189,985 |
| 2017 | $4,501 | $215,885 | $25,900 | $189,985 |
| 2016 | $4,506 | $215,885 | $25,900 | $189,985 |
| 2015 | $4,473 | $215,885 | $25,900 | $189,985 |
| 2014 | $4,183 | $215,885 | $25,900 | $189,985 |
| 2012 | -- | $194,028 | $25,900 | $168,128 |
Source: Public Records
Map
Nearby Homes
Your Personal Tour Guide
Ask me questions while you tour the home.