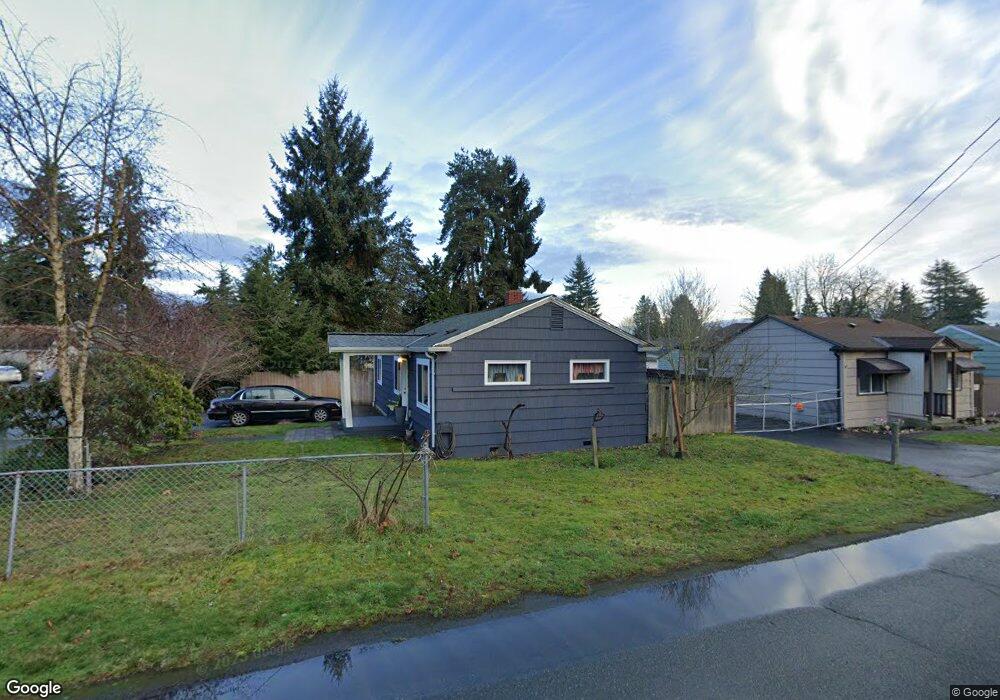
2102 60th St SE Everett, WA 98203
Glacier View NeighborhoodEstimated Value: $489,000 - $529,000
3
Beds
2
Baths
1,015
Sq Ft
$501/Sq Ft
Est. Value
About This Home
This home is located at 2102 60th St SE, Everett, WA 98203 and is currently estimated at $508,748, approximately $501 per square foot. 2102 60th St SE is a home located in Snohomish County with nearby schools including Lowell Elementary School, Evergreen Middle School, and Everett High School.
Ownership History
Date
Name
Owned For
Owner Type
Purchase Details
Closed on
May 24, 2002
Sold by
Green Ryan S and Sutherland Green Tracy
Bought by
Wilkes Stephen J and Wilkes Crista A
Current Estimated Value
Home Financials for this Owner
Home Financials are based on the most recent Mortgage that was taken out on this home.
Original Mortgage
$153,589
Outstanding Balance
$61,440
Interest Rate
6.89%
Mortgage Type
FHA
Estimated Equity
$447,308
Purchase Details
Closed on
Oct 21, 1998
Sold by
Gosser R Jason and Darling Rhonda L
Bought by
Green Ryan S and Sutherland Tracy D
Home Financials for this Owner
Home Financials are based on the most recent Mortgage that was taken out on this home.
Original Mortgage
$133,801
Interest Rate
6.6%
Mortgage Type
FHA
Purchase Details
Closed on
Mar 26, 1996
Sold by
Tri James E and Tri Cheri A
Bought by
Darling Rhonda L and Jason Gosser R
Home Financials for this Owner
Home Financials are based on the most recent Mortgage that was taken out on this home.
Original Mortgage
$108,500
Interest Rate
6.98%
Mortgage Type
Seller Take Back
Create a Home Valuation Report for This Property
The Home Valuation Report is an in-depth analysis detailing your home's value as well as a comparison with similar homes in the area
Home Values in the Area
Average Home Value in this Area
Purchase History
| Date | Buyer | Sale Price | Title Company |
|---|---|---|---|
| Wilkes Stephen J | $156,000 | -- | |
| Green Ryan S | $136,000 | -- | |
| Darling Rhonda L | $110,000 | Chicago Title Ins Co |
Source: Public Records
Mortgage History
| Date | Status | Borrower | Loan Amount |
|---|---|---|---|
| Open | Wilkes Stephen J | $153,589 | |
| Previous Owner | Green Ryan S | $133,801 | |
| Previous Owner | Darling Rhonda L | $108,500 |
Source: Public Records
Tax History
| Year | Tax Paid | Tax Assessment Tax Assessment Total Assessment is a certain percentage of the fair market value that is determined by local assessors to be the total taxable value of land and additions on the property. | Land | Improvement |
|---|---|---|---|---|
| 2026 | $3,386 | $446,200 | $345,000 | $101,200 |
| 2025 | $3,542 | $387,300 | $291,000 | $96,300 |
| 2024 | $3,542 | $411,300 | $315,000 | $96,300 |
| 2023 | $3,603 | $437,600 | $350,000 | $87,600 |
| 2022 | $2,831 | $308,300 | $234,000 | $74,300 |
| 2020 | $2,713 | $241,000 | $175,000 | $66,000 |
| 2019 | $2,437 | $217,900 | $155,000 | $62,900 |
| 2018 | $2,465 | $202,100 | $146,000 | $56,100 |
| 2017 | $2,077 | $169,600 | $120,000 | $49,600 |
| 2016 | $1,639 | $140,600 | $93,000 | $47,600 |
| 2015 | $1,491 | $120,400 | $82,000 | $38,400 |
| 2013 | $1,593 | $113,600 | $63,000 | $50,600 |
Source: Public Records
Map
Nearby Homes
- 5727 Lombard Ave
- 5716 Wetmore Ave
- 6411 Broadway
- 5431 Broadway
- 6606 Lombard Ave Unit 3
- 5302 Wetmore Ave
- 2011 Madison St
- 5320 S 4th Ave
- 6807 Commercial Ave
- 1501 52nd St SE Unit 1
- 5809 Highway Place Unit A203
- 1721 Madison St Unit C
- 1721 Madison St Unit B
- 5101 Delaware Ave
- 2209 Adams Ave
- 5310 S 2nd Ave Unit A
- 1926 Monroe Ave
- 6325 Evergreen Way
- 4907 Delaware Ave
- 5304 Fleming St Unit B
- 6007 Oakes Ave
- 6009 Oakes Ave
- 2118 60th St SE
- 5932 Oakes Ave
- 6002 Oakes Ave
- 5931 Oakes Ave
- 2120 60th St SE
- 2029 60th St SE
- 6010 Oakes Ave
- 6021 Oakes Ave
- 2107 61st St SE
- 5928 Oakes Ave
- 2111 61st St SE
- 6014 Oakes Ave
- 2017 60th St SE
- 2115 61st St SE
- 2119 60th St SE
- 2132 60th St SE
- 5927 Oakes Ave
- 6020 Oakes Ave
Your Personal Tour Guide
Ask me questions while you tour the home.