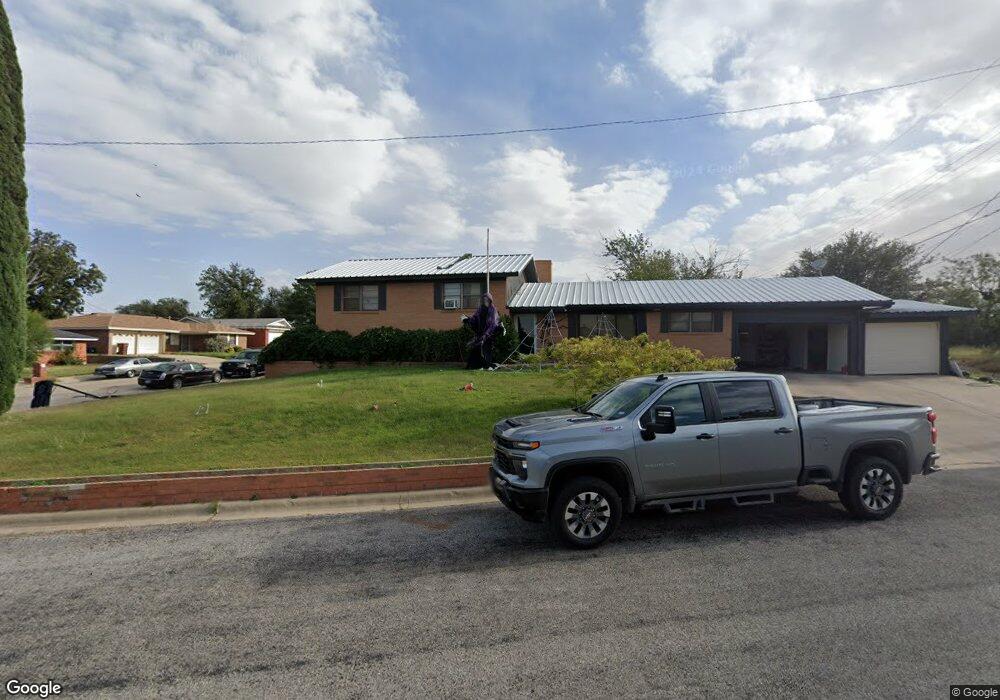
2102 Allendale Rd Big Spring, TX 79720
Estimated Value: $255,060 - $328,000
5
Beds
3
Baths
2,606
Sq Ft
$110/Sq Ft
Est. Value
About This Home
This home is located at 2102 Allendale Rd, Big Spring, TX 79720 and is currently estimated at $285,515, approximately $109 per square foot. 2102 Allendale Rd is a home located in Howard County with nearby schools including Big Spring High School.
Ownership History
Date
Name
Owned For
Owner Type
Purchase Details
Closed on
May 10, 2016
Sold by
Gillihan Enterprises Llc
Bought by
Mendoza Jonathan and Mendoza Sally
Current Estimated Value
Home Financials for this Owner
Home Financials are based on the most recent Mortgage that was taken out on this home.
Original Mortgage
$193,000
Outstanding Balance
$152,646
Interest Rate
3.71%
Mortgage Type
VA
Estimated Equity
$132,869
Purchase Details
Closed on
Aug 8, 2014
Sold by
Gillihan Lonnie R
Bought by
Gillihan Enterprises Llc
Purchase Details
Closed on
Sep 24, 2013
Sold by
Nationstar Mortgage Llc
Bought by
Gillihan Lonnie
Purchase Details
Closed on
Sep 18, 2013
Sold by
Vital Enterprises Inc
Bought by
Metlife Home Loans
Purchase Details
Closed on
Oct 9, 2012
Sold by
Chrance Billy T
Bought by
Metlife Home Loans
Purchase Details
Closed on
Sep 24, 2012
Sold by
Metlife Home Loans
Bought by
Nationstar Mortgage Llc and Champion Mortgage Co
Create a Home Valuation Report for This Property
The Home Valuation Report is an in-depth analysis detailing your home's value as well as a comparison with similar homes in the area
Purchase History
| Date | Buyer | Sale Price | Title Company |
|---|---|---|---|
| Mendoza Jonathan | -- | Surety Title Company | |
| Gillihan Enterprises Llc | -- | None Available | |
| Gillihan Lonnie | -- | None Available | |
| Metlife Home Loans | -- | Fidelity National Title Grou | |
| Metlife Home Loans | $147,706 | None Available | |
| Nationstar Mortgage Llc | -- | None Available |
Source: Public Records
Mortgage History
| Date | Status | Borrower | Loan Amount |
|---|---|---|---|
| Open | Mendoza Jonathan | $193,000 |
Source: Public Records
Tax History
| Year | Tax Paid | Tax Assessment Tax Assessment Total Assessment is a certain percentage of the fair market value that is determined by local assessors to be the total taxable value of land and additions on the property. | Land | Improvement |
|---|---|---|---|---|
| 2025 | $2,393 | $233,452 | $14,580 | $218,872 |
| 2024 | $4,154 | $233,452 | $14,580 | $218,872 |
| 2023 | $4,153 | $235,624 | $11,178 | $224,446 |
| 2022 | $4,906 | $240,327 | $8,100 | $232,227 |
| 2021 | $5,285 | $239,422 | $8,100 | $231,322 |
| 2019 | $5,172 | $204,474 | $8,100 | $196,374 |
| 2018 | $6,205 | $207,093 | $8,100 | $198,993 |
| 2017 | $6,172 | $209,711 | $8,100 | $201,611 |
| 2016 | $6,249 | $212,329 | $8,100 | $204,229 |
| 2015 | -- | $219,184 | $8,100 | $211,084 |
| 2014 | -- | $164,489 | $6,075 | $158,414 |
Source: Public Records
Map
Nearby Homes
- 2300 Cindy Ln
- 1800 Brent Dr
- 2308 Brent Dr
- 2502 Cindy Ln
- 2405 E 25th St
- 2606 Carol Dr
- 2508 E 24th St
- 2604 Ann Dr
- 2507 E 24th St
- Lot 31 Miami Cove
- Lot 25 Miami Cove
- 2701 Larry Dr
- 1710 Alabama St
- 1600 E 17th St
- 1908 Morrison Dr
- 2704 Shirley Dr
- 2706 Shirley Dr
- 2402 S Monticello St
- 2710 Shirley Dr
- 2608 E 24th St
Your Personal Tour Guide
Ask me questions while you tour the home.