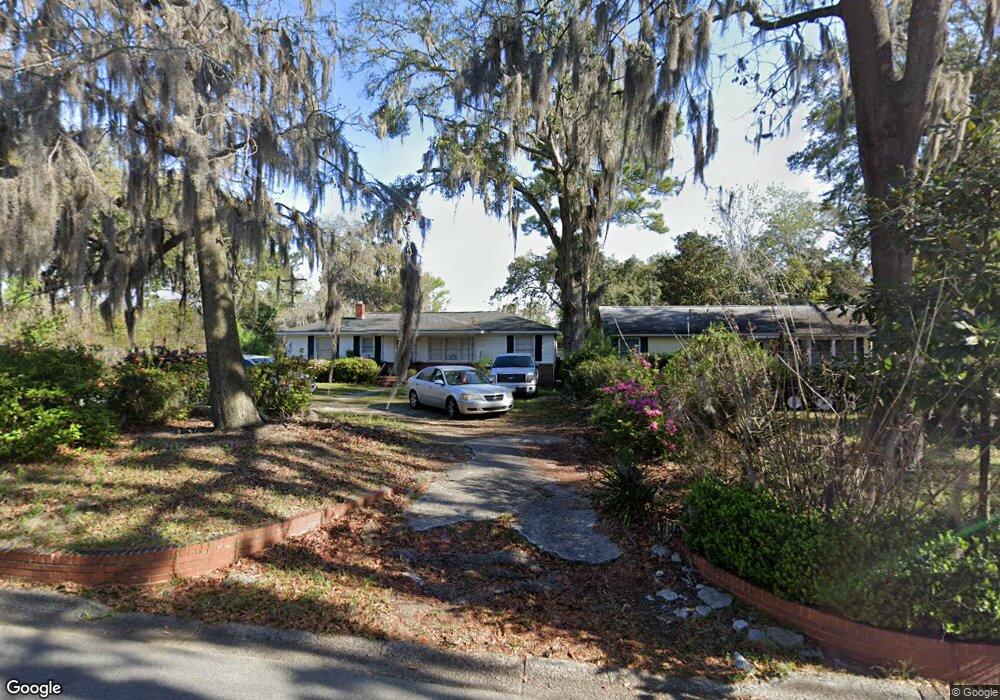
2102 E 62nd St Savannah, GA 31404
LaRoche Park-Springhill-Daffin Heights NeighborhoodEstimated Value: $238,455 - $276,000
3
Beds
1
Bath
1,370
Sq Ft
$187/Sq Ft
Est. Value
About This Home
This home is located at 2102 E 62nd St, Savannah, GA 31404 and is currently estimated at $256,114, approximately $186 per square foot. 2102 E 62nd St is a home located in Chatham County with nearby schools including Myers Middle School, Jenkins High School, and Calvary Day School.
Ownership History
Date
Name
Owned For
Owner Type
Purchase Details
Closed on
Oct 27, 2017
Sold by
Denton Janet Moody
Bought by
Lanier Debra M
Current Estimated Value
Home Financials for this Owner
Home Financials are based on the most recent Mortgage that was taken out on this home.
Original Mortgage
$45,000
Outstanding Balance
$9,588
Interest Rate
3.83%
Mortgage Type
New Conventional
Estimated Equity
$246,526
Purchase Details
Closed on
Dec 30, 2012
Sold by
Moody Janet M
Bought by
Lanier Debra M
Purchase Details
Closed on
Dec 16, 2011
Sold by
Crosby Robin C
Bought by
Mclean Moody Janet
Purchase Details
Closed on
Dec 14, 2011
Sold by
Bieber Sherri L
Bought by
Mclean Moody Janet
Purchase Details
Closed on
Oct 18, 2011
Sold by
Moody James Madison
Bought by
Moody Janet Mclean
Purchase Details
Closed on
Nov 12, 2009
Sold by
Moody James Madison
Bought by
Moody Moody James Madison James Madison and Moody Lanier Debra
Create a Home Valuation Report for This Property
The Home Valuation Report is an in-depth analysis detailing your home's value as well as a comparison with similar homes in the area
Home Values in the Area
Average Home Value in this Area
Purchase History
| Date | Buyer | Sale Price | Title Company |
|---|---|---|---|
| Lanier Debra M | $45,000 | -- | |
| Lanier Debra M | $8,500 | -- | |
| Mclean Moody Janet | $6,000 | -- | |
| Moody Janet Mclean | $6,000 | -- | |
| Mclean Moody Janet | $11,000 | -- | |
| Moody Janet Mclean | $11,000 | -- | |
| Moody Janet Mclean | -- | -- | |
| Moody Janet Mclean | -- | -- | |
| Moody Moody James Madison James Madison | -- | -- |
Source: Public Records
Mortgage History
| Date | Status | Borrower | Loan Amount |
|---|---|---|---|
| Open | Lanier Debra M | $45,000 |
Source: Public Records
Tax History
| Year | Tax Paid | Tax Assessment Tax Assessment Total Assessment is a certain percentage of the fair market value that is determined by local assessors to be the total taxable value of land and additions on the property. | Land | Improvement |
|---|---|---|---|---|
| 2025 | $1,966 | $74,440 | $20,000 | $54,440 |
| 2024 | $19 | $67,280 | $20,000 | $47,280 |
| 2023 | $812 | $66,560 | $13,120 | $53,440 |
| 2022 | $1,091 | $51,560 | $13,120 | $38,440 |
| 2021 | $1,531 | $35,400 | $5,960 | $29,440 |
| 2020 | $1,110 | $35,240 | $5,960 | $29,280 |
| 2019 | $1,562 | $35,160 | $5,960 | $29,200 |
| 2018 | $759 | $24,040 | $5,960 | $18,080 |
| 2017 | $721 | $24,600 | $5,960 | $18,640 |
| 2016 | $720 | $24,680 | $5,960 | $18,720 |
| 2015 | $961 | $23,040 | $5,960 | $17,080 |
| 2014 | $1,308 | $23,640 | $0 | $0 |
Source: Public Records
Map
Nearby Homes
- 2105 E 60th St
- 2044 E 60th St
- 2202 E 62nd St
- 2300 Mason Dr
- 1913 E 60th St
- 1818 E 60th St
- 2009 E 57th St
- 2223 Armstrong Dr
- 2110 E 56th St
- 2305 Lorraine Dr
- 1804 Delesseps Ave
- 1902 E 57th St
- 2309 Lorraine Dr
- 2221 Lorraine Ct
- 2101 Oakland Ct Unit A & B
- 1710 E 59th St
- 2206 Mason Dr
- 2207 Mason Dr
- 2338 Lorraine Dr
- 108 Walz Cir
Your Personal Tour Guide
Ask me questions while you tour the home.