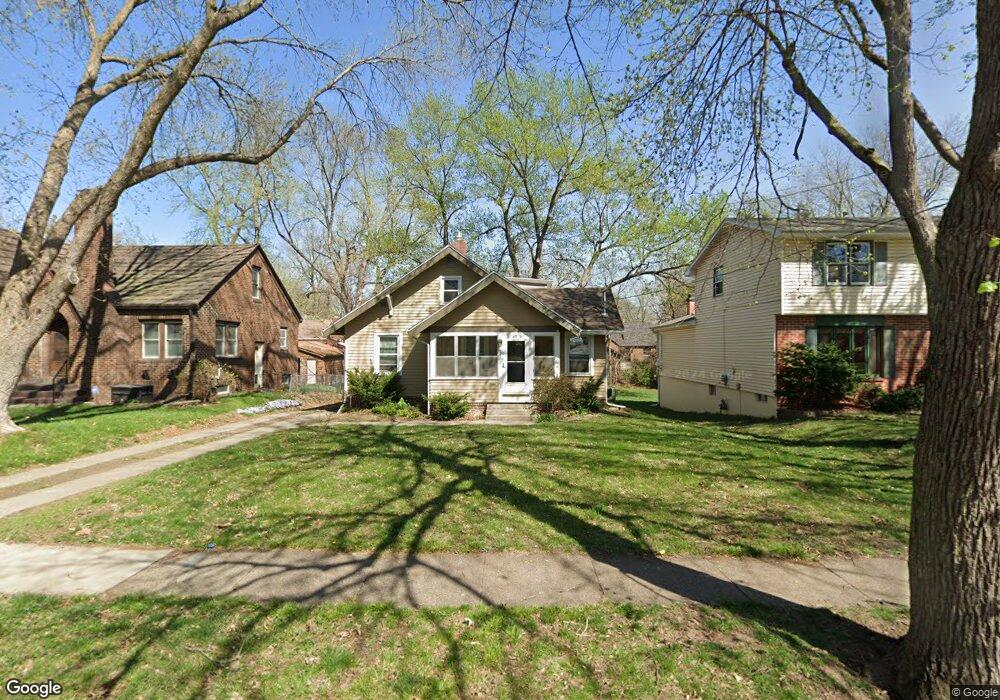
2103 40th Place Des Moines, IA 50310
Beaverdale NeighborhoodEstimated Value: $261,000 - $292,640
3
Beds
3
Baths
1,479
Sq Ft
$187/Sq Ft
Est. Value
About This Home
This home is located at 2103 40th Place, Des Moines, IA 50310 and is currently estimated at $276,910, approximately $187 per square foot. 2103 40th Place is a home located in Polk County with nearby schools including Perkins Elementary School, Merrill Middle School, and Roosevelt High School.
Ownership History
Date
Name
Owned For
Owner Type
Purchase Details
Closed on
Jul 27, 2007
Sold by
Wainwright James R and Wainwright Kathleen M
Bought by
Clancy Erin M
Current Estimated Value
Home Financials for this Owner
Home Financials are based on the most recent Mortgage that was taken out on this home.
Original Mortgage
$132,000
Outstanding Balance
$83,618
Interest Rate
6.76%
Mortgage Type
Purchase Money Mortgage
Estimated Equity
$193,292
Purchase Details
Closed on
Nov 15, 2001
Sold by
Calligan Jamison David and Calligan Stephanie Ann
Bought by
Stephenson Suzanne K
Purchase Details
Closed on
Apr 29, 2000
Sold by
Funk James Henry and Funk Ann Elizabeth
Bought by
Wainwright James R and Wainwright Kathleen M
Home Financials for this Owner
Home Financials are based on the most recent Mortgage that was taken out on this home.
Original Mortgage
$101,650
Interest Rate
7.75%
Create a Home Valuation Report for This Property
The Home Valuation Report is an in-depth analysis detailing your home's value as well as a comparison with similar homes in the area
Home Values in the Area
Average Home Value in this Area
Purchase History
| Date | Buyer | Sale Price | Title Company |
|---|---|---|---|
| Clancy Erin M | $138,500 | Itc | |
| Stephenson Suzanne K | $58,500 | -- | |
| Wainwright James R | $106,500 | -- |
Source: Public Records
Mortgage History
| Date | Status | Borrower | Loan Amount |
|---|---|---|---|
| Open | Clancy Erin M | $132,000 | |
| Previous Owner | Wainwright James R | $101,650 |
Source: Public Records
Tax History Compared to Growth
Tax History
| Year | Tax Paid | Tax Assessment Tax Assessment Total Assessment is a certain percentage of the fair market value that is determined by local assessors to be the total taxable value of land and additions on the property. | Land | Improvement |
|---|---|---|---|---|
| 2025 | $4,768 | $285,200 | $45,600 | $239,600 |
| 2024 | $4,768 | $252,800 | $41,000 | $211,800 |
| 2023 | $4,754 | $252,800 | $41,000 | $211,800 |
| 2022 | $4,716 | $210,600 | $36,200 | $174,400 |
| 2021 | $4,552 | $210,600 | $36,200 | $174,400 |
| 2020 | $4,724 | $191,000 | $33,100 | $157,900 |
| 2019 | $4,224 | $191,000 | $33,100 | $157,900 |
| 2018 | $4,176 | $165,700 | $29,500 | $136,200 |
| 2017 | $3,702 | $165,700 | $29,500 | $136,200 |
| 2016 | $3,602 | $145,400 | $25,800 | $119,600 |
| 2015 | $3,602 | $145,400 | $25,800 | $119,600 |
| 2014 | $3,214 | $134,400 | $23,600 | $110,800 |
Source: Public Records
Map
Nearby Homes