J
Seller's Agent in 2025
Jackson Maddox
TAH Tennessee dba Tricon American Homes
(713) 387-9899
1 Total Sale
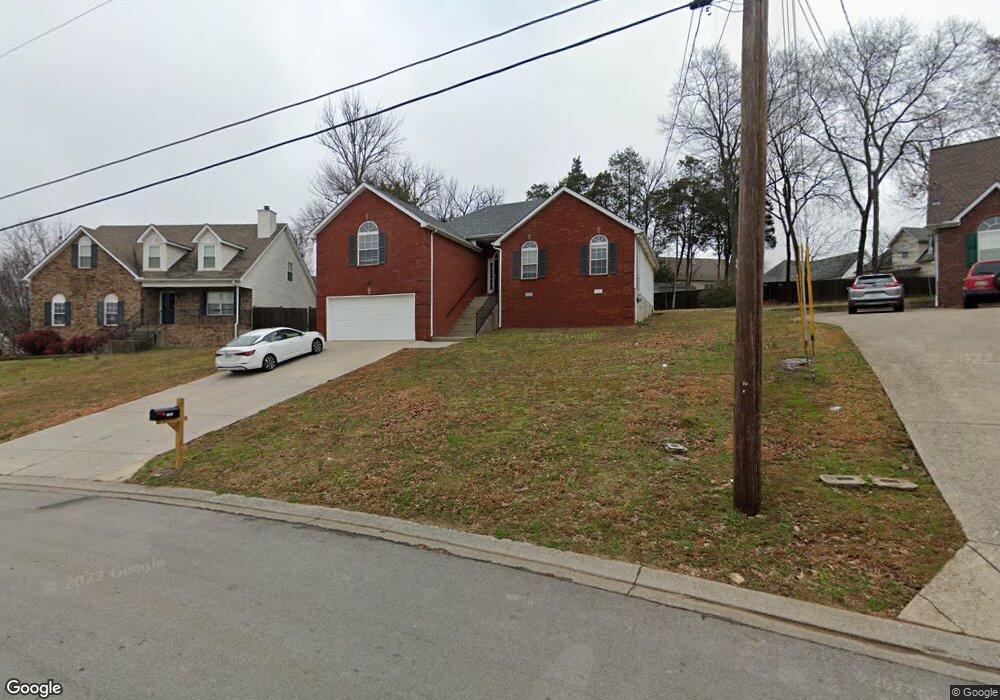
This home is located at 2103 Academy Way, La Vergne, TN 37086 and is currently estimated at $391,427, approximately $206 per square foot. 2103 Academy Way is a home located in Rutherford County with nearby schools including Cedar Grove Elementary School, Rock Springs Middle School, and Lavergne High School.
| Date | Buyer | Sale Price | Title Company |
|---|---|---|---|
| Sfr Jv 1 Property Llc | $315,560 | Bell Law Settlement Svcs Llc | |
| Williams Kawona | $230,000 | Anchor Title Llc | |
| Holt | $135,500 | -- |
| Date | Status | Borrower | Loan Amount |
|---|---|---|---|
| Previous Owner | Williams Kawona | $225,934 |
| Date | Event | Price | List to Sale | Price per Sq Ft | Prior Sale |
|---|---|---|---|---|---|
| 07/23/2025 07/23/25 | Rented | -- | -- | -- | |
| 04/10/2025 04/10/25 | Under Contract | -- | -- | -- | |
| 03/26/2025 03/26/25 | Price Changed | $2,299 | +9.5% | $1 / Sq Ft | |
| 03/25/2025 03/25/25 | For Rent | $2,099 | -99.3% | -- | |
| 10/14/2021 10/14/21 | Rented | -- | -- | -- | |
| 10/08/2021 10/08/21 | Under Contract | -- | -- | -- | |
| 09/27/2021 09/27/21 | For Rent | -- | -- | -- | |
| 07/15/2021 07/15/21 | Sold | $315,560 | +5.2% | $166 / Sq Ft | View Prior Sale |
| 06/02/2021 06/02/21 | Pending | -- | -- | -- | |
| 05/14/2021 05/14/21 | For Sale | $299,999 | -- | $158 / Sq Ft |
| Year | Tax Paid | Tax Assessment Tax Assessment Total Assessment is a certain percentage of the fair market value that is determined by local assessors to be the total taxable value of land and additions on the property. | Land | Improvement |
|---|---|---|---|---|
| 2025 | $1,982 | $82,150 | $13,750 | $68,400 |
| 2024 | $1,982 | $82,150 | $13,750 | $68,400 |
| 2023 | $1,541 | $82,150 | $13,750 | $68,400 |
| 2022 | $1,328 | $82,150 | $13,750 | $68,400 |
| 2021 | $1,240 | $55,850 | $8,625 | $47,225 |
| 2020 | $1,240 | $55,850 | $8,625 | $47,225 |
| 2019 | $1,240 | $55,850 | $8,625 | $47,225 |
| 2018 | $1,570 | $55,850 | $0 | $0 |
| 2017 | $1,441 | $39,700 | $0 | $0 |
| 2016 | $1,441 | $39,700 | $0 | $0 |
| 2015 | $1,451 | $39,700 | $0 | $0 |
| 2014 | $987 | $39,700 | $0 | $0 |
| 2013 | -- | $41,225 | $0 | $0 |
J
Seller's Agent in 2025
Jackson Maddox
TAH Tennessee dba Tricon American Homes
(713) 387-9899
1 Total Sale
N
Buyer's Agent in 2025
NONMLS NONMLS

Seller's Agent in 2021
Autumn Faughn
Berkshire Hathaway HomeServices Woodmont Realty
(615) 292-3552
5 in this area
130 Total Sales
K
Seller's Agent in 2021
Kim Eversole
Invitation Homes Realty, LLC
(615) 920-4912
M
Buyer's Agent in 2021
Marshall Casselman
eXp Realty
(704) 774-0308
30 in this area
839 Total Sales