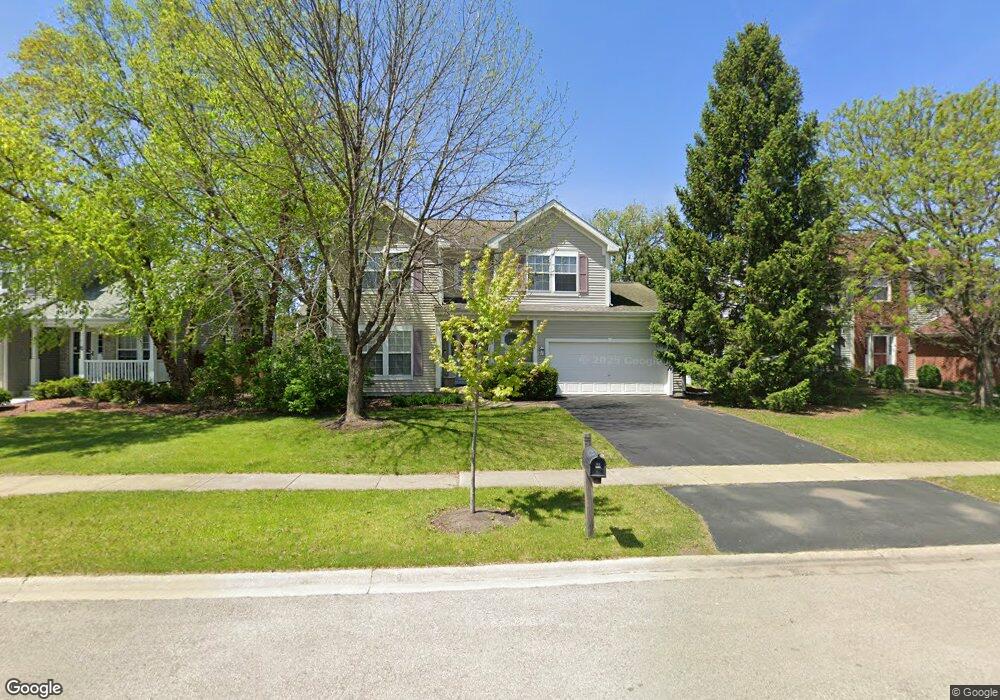
2103 Glenridge Ct Plainfield, IL 60586
Fall Creek NeighborhoodEstimated Value: $409,000 - $490,000
4
Beds
3
Baths
2,750
Sq Ft
$162/Sq Ft
Est. Value
About This Home
This home is located at 2103 Glenridge Ct, Plainfield, IL 60586 and is currently estimated at $444,199, approximately $161 per square foot. 2103 Glenridge Ct is a home located in Will County with nearby schools including Ridge Elementary School, Drauden Point Middle School, and Plainfield South High School.
Ownership History
Date
Name
Owned For
Owner Type
Purchase Details
Closed on
May 21, 2012
Sold by
Crespo Brian and Crespo Alissa
Bought by
Crespo Alissa
Current Estimated Value
Purchase Details
Closed on
Feb 19, 2007
Sold by
Murphy Joseph and Murphy Ellen
Bought by
Crespo Brian J and Crespo Alissa B
Home Financials for this Owner
Home Financials are based on the most recent Mortgage that was taken out on this home.
Original Mortgage
$242,000
Interest Rate
6.18%
Mortgage Type
Purchase Money Mortgage
Purchase Details
Closed on
Jun 24, 2004
Sold by
Gmac Model Home Finance Inc
Bought by
Murphy Joseph and Bonham Ellen
Home Financials for this Owner
Home Financials are based on the most recent Mortgage that was taken out on this home.
Original Mortgage
$254,400
Interest Rate
5.12%
Mortgage Type
Purchase Money Mortgage
Purchase Details
Closed on
Sep 28, 2001
Sold by
William Ryan Homes Inc
Bought by
Gmac Model Home Finance Inc
Create a Home Valuation Report for This Property
The Home Valuation Report is an in-depth analysis detailing your home's value as well as a comparison with similar homes in the area
Home Values in the Area
Average Home Value in this Area
Purchase History
| Date | Buyer | Sale Price | Title Company |
|---|---|---|---|
| Crespo Alissa | -- | None Available | |
| Crespo Brian J | $315,000 | Millennium Title Group | |
| Murphy Joseph | $318,000 | Ticor Title Insurance Compan | |
| Gmac Model Home Finance Inc | $244,000 | -- |
Source: Public Records
Mortgage History
| Date | Status | Borrower | Loan Amount |
|---|---|---|---|
| Previous Owner | Crespo Brian J | $242,000 | |
| Previous Owner | Murphy Joseph | $254,400 | |
| Closed | Murphy Joseph | $47,000 |
Source: Public Records
Tax History
| Year | Tax Paid | Tax Assessment Tax Assessment Total Assessment is a certain percentage of the fair market value that is determined by local assessors to be the total taxable value of land and additions on the property. | Land | Improvement |
|---|---|---|---|---|
| 2024 | $9,402 | $139,279 | $24,056 | $115,223 |
| 2023 | $9,402 | $125,794 | $21,727 | $104,067 |
| 2022 | $8,823 | $118,360 | $20,443 | $97,917 |
| 2021 | $8,373 | $110,617 | $19,106 | $91,511 |
| 2020 | $8,250 | $107,479 | $18,564 | $88,915 |
| 2019 | $7,968 | $102,409 | $17,688 | $84,721 |
| 2018 | $7,633 | $96,219 | $16,619 | $79,600 |
| 2017 | $7,411 | $91,437 | $15,793 | $75,644 |
| 2016 | $7,266 | $87,207 | $15,062 | $72,145 |
| 2015 | $6,791 | $81,693 | $14,110 | $67,583 |
| 2014 | $6,791 | $78,809 | $13,612 | $65,197 |
| 2013 | $6,791 | $78,809 | $13,612 | $65,197 |
Source: Public Records
Map
Nearby Homes
- 2008 Gray Hawk Ct
- 2115 Stafford Ct Unit 3
- 1919 Spring Ridge Dr
- 2302 Red Hawk Dr
- 25011 W Ann Ct
- 2110 Wynham Lakes Ct
- 5924 Glass Pointe Cir
- 0 Theodore St
- 1808 Castle Ridge Dr
- 0001 S State Route 59
- 0002 S State Route 59
- 6510 Jack Rogers Ln
- 2509 Ruth Fitzgerald Dr
- 2542 Stonybrook Dr
- 5312 Floralwood Ct
- 2004 Kingsbury Estates Dr
- 2710 Telluride Ct
- 6701 Buchanan Cir
- 1605 Cascade Ridge Dr Unit 3
- 6703 Buchanan Cir
- 2105 Glenridge Ct Unit 1
- 2101 Glenridge Ct
- 2104 Stafford Ct Unit 1
- 2102 Stafford Ct Unit 1
- 2107 Glenridge Ct
- 2106 Stafford Ct
- 2104 Glenridge Ct
- 2108 Stafford Ct
- 2106 Glenridge Ct Unit 1
- 2109 Glenridge Ct
- 2102 Glenridge Ct
- 2108 Glenridge Ct
- 2017 Glenridge Ct
- 7168 Caton Farm Rd
- 2110 Stafford Ct Unit 1
- 2016 Stafford St
- 2111 Glenridge Ct
- 2110 Glenridge Ct
- 2103 Stafford Ct
- 2105 Stafford Ct
Your Personal Tour Guide
Ask me questions while you tour the home.