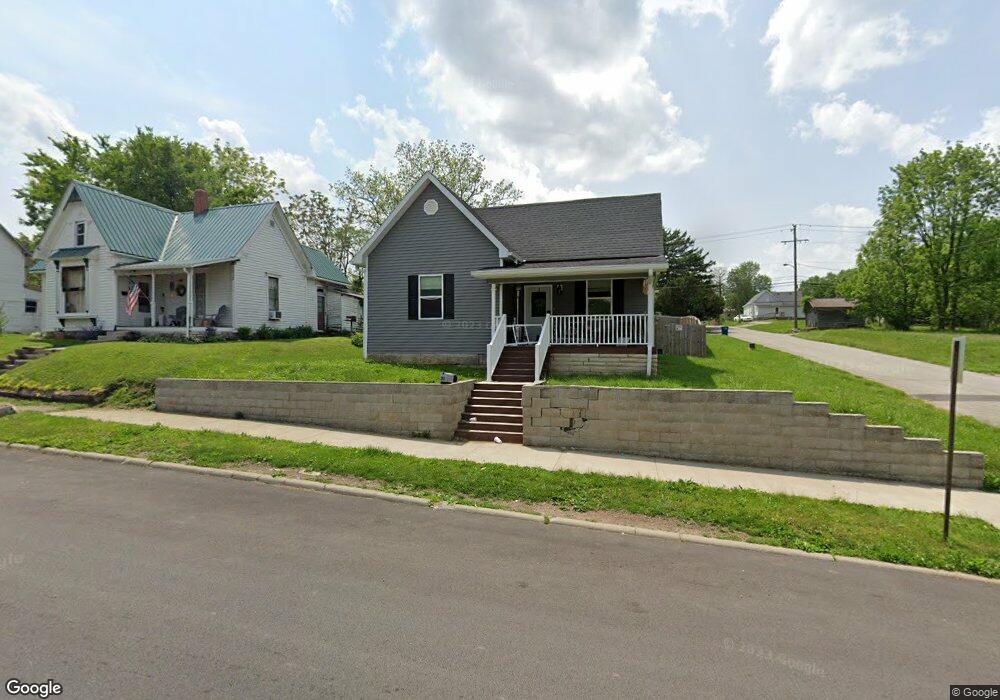
2103 H St Bedford, IN 47421
Estimated Value: $156,000 - $200,569
2
Beds
1
Bath
1,120
Sq Ft
$163/Sq Ft
Est. Value
About This Home
This home is located at 2103 H St, Bedford, IN 47421 and is currently estimated at $182,142, approximately $162 per square foot. 2103 H St is a home located in Lawrence County with nearby schools including Bedford North Lawrence High School, St. Vincent de Paul School, and Stone City Christian Academy.
Ownership History
Date
Name
Owned For
Owner Type
Purchase Details
Closed on
Jul 2, 2021
Sold by
Manion Marsha D
Bought by
Walter-Ketcham Jake D and Lynn-Diehl Alissia R
Current Estimated Value
Home Financials for this Owner
Home Financials are based on the most recent Mortgage that was taken out on this home.
Original Mortgage
$152,525
Outstanding Balance
$138,393
Interest Rate
2.9%
Mortgage Type
Stand Alone Refi Refinance Of Original Loan
Estimated Equity
$43,749
Purchase Details
Closed on
Aug 12, 2020
Sold by
Ford Lea M
Bought by
Manion Marsha and Manion Mercedes
Purchase Details
Closed on
Feb 28, 2013
Sold by
Jeanine Lois
Bought by
James E
Create a Home Valuation Report for This Property
The Home Valuation Report is an in-depth analysis detailing your home's value as well as a comparison with similar homes in the area
Home Values in the Area
Average Home Value in this Area
Purchase History
| Date | Buyer | Sale Price | Title Company |
|---|---|---|---|
| Walter-Ketcham Jake D | $302,000 | None Available | |
| Manion Marsha | -- | None Available | |
| James E | $4,500 | Classic Title Inc | |
| Murphy James F | -- | -- |
Source: Public Records
Mortgage History
| Date | Status | Borrower | Loan Amount |
|---|---|---|---|
| Open | Walter-Ketcham Jake D | $152,525 |
Source: Public Records
Tax History Compared to Growth
Tax History
| Year | Tax Paid | Tax Assessment Tax Assessment Total Assessment is a certain percentage of the fair market value that is determined by local assessors to be the total taxable value of land and additions on the property. | Land | Improvement |
|---|---|---|---|---|
| 2024 | $1,558 | $155,800 | $8,600 | $147,200 |
| 2023 | $1,385 | $138,500 | $8,400 | $130,100 |
| 2022 | $1,293 | $129,300 | $8,100 | $121,200 |
| 2021 | $1,159 | $115,900 | $7,900 | $108,000 |
| 2020 | $3,036 | $101,200 | $7,600 | $93,600 |
| 2019 | $2,883 | $96,100 | $7,400 | $88,700 |
| 2018 | $291 | $9,700 | $7,300 | $2,400 |
| 2017 | $282 | $9,400 | $7,100 | $2,300 |
| 2016 | $273 | $9,100 | $6,900 | $2,200 |
| 2014 | $282 | $9,400 | $6,900 | $2,500 |
Source: Public Records
Map
Nearby Homes