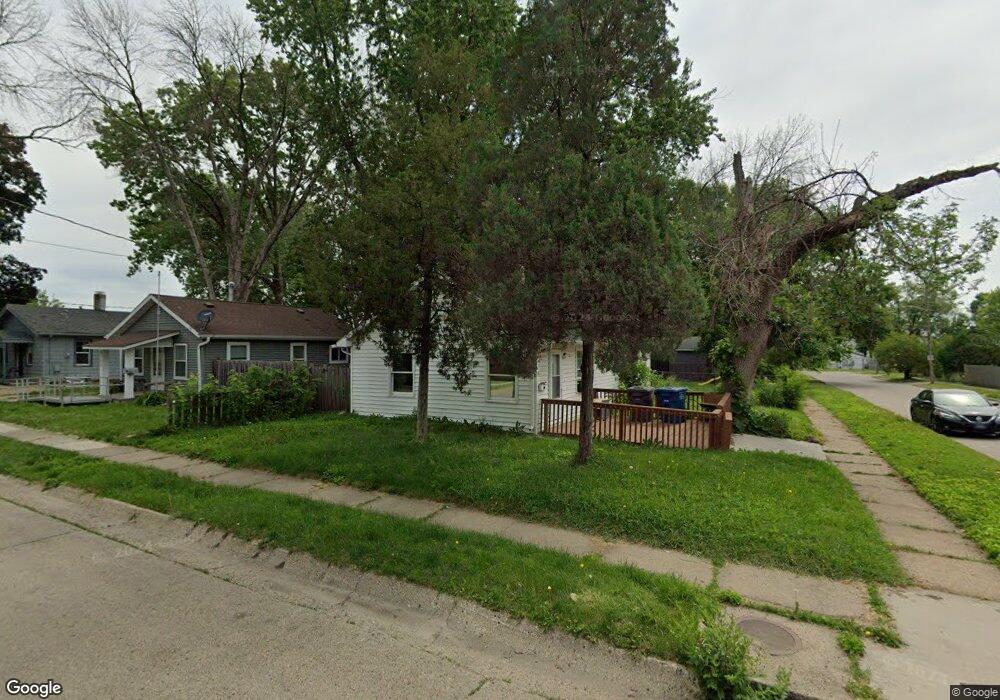
2103 Lay St Des Moines, IA 50317
Fairmont Park NeighborhoodEstimated Value: $122,000 - $156,000
3
Beds
1
Bath
934
Sq Ft
$151/Sq Ft
Est. Value
About This Home
This home is located at 2103 Lay St, Des Moines, IA 50317 and is currently estimated at $140,794, approximately $150 per square foot. 2103 Lay St is a home located in Polk County with nearby schools including Phillips Elementary, Goodrell Middle School, and North High School.
Ownership History
Date
Name
Owned For
Owner Type
Purchase Details
Closed on
May 15, 2013
Sold by
Liberty Bank F S B
Bought by
Hiskey William
Current Estimated Value
Purchase Details
Closed on
Mar 17, 2011
Sold by
Marasco Michael and Marasco Kathryn
Bought by
Ollin Monte and Ollin Krista
Home Financials for this Owner
Home Financials are based on the most recent Mortgage that was taken out on this home.
Original Mortgage
$59,500
Interest Rate
9%
Mortgage Type
Seller Take Back
Purchase Details
Closed on
Oct 17, 2007
Sold by
Marasco Michael A and Marasco Kathryn K
Bought by
Kanes Stacey W and Atwood Nicolle L
Home Financials for this Owner
Home Financials are based on the most recent Mortgage that was taken out on this home.
Original Mortgage
$73,000
Interest Rate
6.5%
Mortgage Type
Seller Take Back
Purchase Details
Closed on
Oct 8, 2001
Sold by
Marasco Michael A and Marasco Kathryn K
Bought by
Olson Michael R
Home Financials for this Owner
Home Financials are based on the most recent Mortgage that was taken out on this home.
Original Mortgage
$69,900
Interest Rate
10.25%
Mortgage Type
Seller Take Back
Purchase Details
Closed on
Dec 4, 2000
Sold by
Marasco Michael A and Marasco Kathryn K
Bought by
Weander David D
Home Financials for this Owner
Home Financials are based on the most recent Mortgage that was taken out on this home.
Original Mortgage
$70,100
Interest Rate
9.75%
Mortgage Type
Seller Take Back
Purchase Details
Closed on
Aug 24, 2000
Sold by
Snyder Alvin
Bought by
Marasco Michael A and Marasco Kathryn K
Home Financials for this Owner
Home Financials are based on the most recent Mortgage that was taken out on this home.
Original Mortgage
$58,800
Interest Rate
9%
Purchase Details
Closed on
Nov 8, 1999
Sold by
Snyder Alvin
Bought by
Marasco Michael A and Marasco Kathryn K
Home Financials for this Owner
Home Financials are based on the most recent Mortgage that was taken out on this home.
Original Mortgage
$8,500
Interest Rate
7.78%
Mortgage Type
Seller Take Back
Create a Home Valuation Report for This Property
The Home Valuation Report is an in-depth analysis detailing your home's value as well as a comparison with similar homes in the area
Home Values in the Area
Average Home Value in this Area
Purchase History
| Date | Buyer | Sale Price | Title Company |
|---|---|---|---|
| Hiskey William | $21,500 | None Available | |
| Ollin Monte | $62,000 | None Available | |
| Kanes Stacey W | $75,000 | None Available | |
| Olson Michael R | $74,900 | -- | |
| Weander David D | $73,500 | -- | |
| Marasco Michael A | $10,500 | -- | |
| Marasco Michael A | $11,000 | -- |
Source: Public Records
Mortgage History
| Date | Status | Borrower | Loan Amount |
|---|---|---|---|
| Previous Owner | Ollin Monte | $59,500 | |
| Previous Owner | Kanes Stacey W | $73,000 | |
| Previous Owner | Olson Michael R | $69,900 | |
| Previous Owner | Weander David D | $70,100 | |
| Previous Owner | Marasco Michael A | $58,800 | |
| Previous Owner | Marasco Michael A | $8,500 |
Source: Public Records
Tax History Compared to Growth
Tax History
| Year | Tax Paid | Tax Assessment Tax Assessment Total Assessment is a certain percentage of the fair market value that is determined by local assessors to be the total taxable value of land and additions on the property. | Land | Improvement |
|---|---|---|---|---|
| 2025 | $1,918 | $112,300 | $23,100 | $89,200 |
| 2024 | $1,918 | $97,500 | $20,000 | $77,500 |
| 2023 | $1,772 | $97,500 | $20,000 | $77,500 |
| 2022 | $1,758 | $75,200 | $15,800 | $59,400 |
| 2021 | $1,650 | $75,200 | $15,800 | $59,400 |
| 2020 | $1,714 | $66,100 | $14,000 | $52,100 |
| 2019 | $1,472 | $66,100 | $14,000 | $52,100 |
| 2018 | $1,458 | $54,800 | $11,600 | $43,200 |
| 2017 | $1,444 | $54,800 | $11,600 | $43,200 |
| 2016 | $1,408 | $53,400 | $11,200 | $42,200 |
| 2015 | $1,408 | $53,400 | $11,200 | $42,200 |
| 2014 | $1,456 | $54,800 | $11,400 | $43,400 |
Source: Public Records
Map
Nearby Homes
- 2021 E 25th St
- 2216 Lay St
- 1821 E 25th St
- 2112 E 23rd St
- 1901 E 23rd St
- 2124 E 23rd St
- 2322 Guthrie Ave
- 1905 Searle St
- 2100 Searle St
- 2323 E 23rd St
- 2324 E 23rd St
- 1915 E 22nd St
- 2503 E 24th St
- 2208 Tichenor St
- 1614 Searle St
- 2645 Wisconsin Ave
- 1603 Searle St
- 1601 E 22nd St
- 2809 E 24th St
- 2757 Easton Blvd