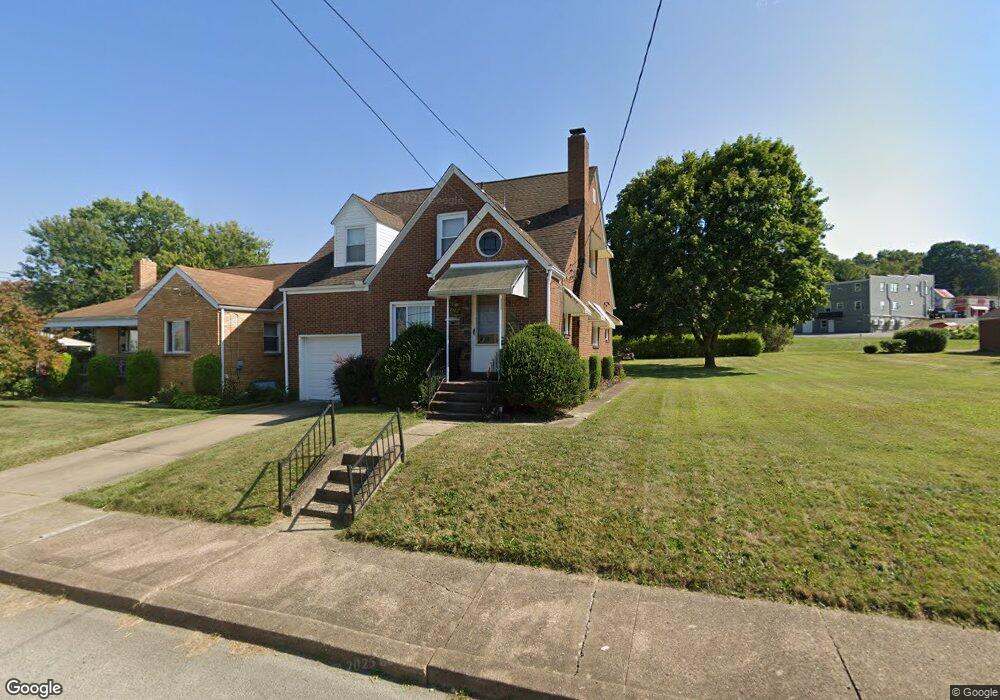
2103 Mclean St Aliquippa, PA 15001
Estimated Value: $165,000 - $191,000
3
Beds
2
Baths
2,535
Sq Ft
$68/Sq Ft
Est. Value
About This Home
This home is located at 2103 Mclean St, Aliquippa, PA 15001 and is currently estimated at $172,373, approximately $67 per square foot. 2103 Mclean St is a home located in Beaver County with nearby schools including Aliquippa Elementary School, Aliquippa Junior/Senior High School, and Our Lady Of Fatima Elementary School.
Ownership History
Date
Name
Owned For
Owner Type
Purchase Details
Closed on
Mar 18, 2010
Sold by
Raub Allen L and Raub Charlotte J
Bought by
Grimm Laura N
Current Estimated Value
Home Financials for this Owner
Home Financials are based on the most recent Mortgage that was taken out on this home.
Original Mortgage
$73,260
Outstanding Balance
$49,206
Interest Rate
5.25%
Mortgage Type
FHA
Estimated Equity
$123,167
Create a Home Valuation Report for This Property
The Home Valuation Report is an in-depth analysis detailing your home's value as well as a comparison with similar homes in the area
Home Values in the Area
Average Home Value in this Area
Purchase History
| Date | Buyer | Sale Price | Title Company |
|---|---|---|---|
| Grimm Laura N | $84,000 | None Available |
Source: Public Records
Mortgage History
| Date | Status | Borrower | Loan Amount |
|---|---|---|---|
| Open | Grimm Laura N | $73,260 |
Source: Public Records
Tax History
| Year | Tax Paid | Tax Assessment Tax Assessment Total Assessment is a certain percentage of the fair market value that is determined by local assessors to be the total taxable value of land and additions on the property. | Land | Improvement |
|---|---|---|---|---|
| 2025 | $511 | $69,600 | $7,750 | $61,850 |
| 2024 | $2,705 | $69,600 | $7,750 | $61,850 |
| 2023 | $2,706 | $20,550 | $3,300 | $17,250 |
| 2022 | $2,648 | $20,550 | $3,300 | $17,250 |
| 2021 | $2,648 | $20,550 | $3,300 | $17,250 |
| 2020 | $2,584 | $20,550 | $3,300 | $17,250 |
| 2019 | $534 | $20,550 | $3,300 | $17,250 |
| 2018 | $2,485 | $20,550 | $3,300 | $17,250 |
| 2017 | $1,753 | $20,550 | $3,300 | $17,250 |
| 2016 | $2,320 | $20,550 | $3,300 | $17,250 |
| 2015 | $456 | $20,550 | $3,300 | $17,250 |
| 2014 | $456 | $20,550 | $3,300 | $17,250 |
Source: Public Records
Map
Nearby Homes
Your Personal Tour Guide
Ask me questions while you tour the home.