Estimated Value: $385,000 - $439,000
3
Beds
2
Baths
1,690
Sq Ft
$242/Sq Ft
Est. Value
About This Home
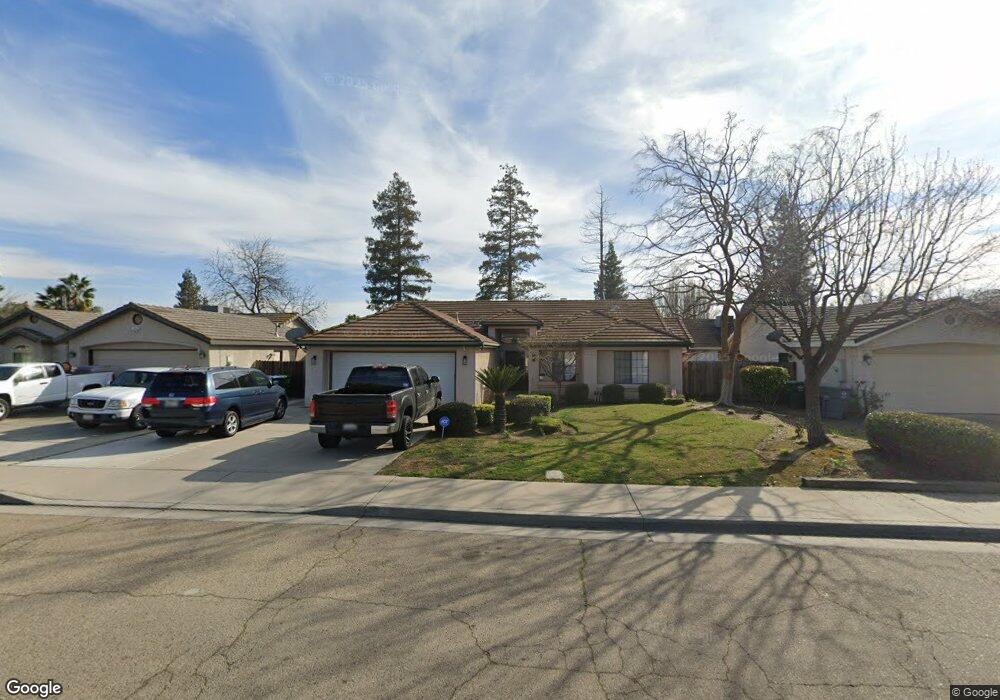
This home is located at 2103 Oak St, Selma, CA 93662 and is currently estimated at $408,859, approximately $241 per square foot. 2103 Oak St is a home located in Fresno County with nearby schools including Theodore Roosevelt Elementary School, Abraham Lincoln Middle School, and Selma High School.
Ownership History
Date
Name
Owned For
Owner Type
Purchase Details
Closed on
Jan 9, 2003
Sold by
Barnes Keith and Barnes Lisa
Bought by
Barnes Keith A and Barnes Lisa S
Current Estimated Value
Purchase Details
Closed on
Oct 22, 2002
Sold by
Barnes Keith and Barnes Lisa S
Bought by
Barnes Keith and Barnes Lisa
Home Financials for this Owner
Home Financials are based on the most recent Mortgage that was taken out on this home.
Original Mortgage
$101,750
Interest Rate
3.5%
Mortgage Type
Stand Alone First
Purchase Details
Closed on
Jul 1, 1998
Sold by
Keith Barnes and Dwelle Lisa S
Bought by
Barnes Keith and Barnes Lisa S
Create a Home Valuation Report for This Property
The Home Valuation Report is an in-depth analysis detailing your home's value as well as a comparison with similar homes in the area
Home Values in the Area
Average Home Value in this Area
Purchase History
| Date | Buyer | Sale Price | Title Company |
|---|---|---|---|
| Barnes Keith A | -- | -- | |
| Barnes Keith | -- | First American Title Ins Co | |
| Barnes Keith | -- | First American Title Ins Co |
Source: Public Records
Mortgage History
| Date | Status | Borrower | Loan Amount |
|---|---|---|---|
| Closed | Barnes Keith | $101,750 |
Source: Public Records
Tax History
| Year | Tax Paid | Tax Assessment Tax Assessment Total Assessment is a certain percentage of the fair market value that is determined by local assessors to be the total taxable value of land and additions on the property. | Land | Improvement |
|---|---|---|---|---|
| 2025 | $3,645 | $213,863 | $55,689 | $158,174 |
| 2023 | $3,113 | $205,561 | $53,528 | $152,033 |
| 2022 | $3,375 | $201,531 | $52,479 | $149,052 |
| 2021 | $3,298 | $197,580 | $51,450 | $146,130 |
| 2020 | $3,267 | $195,555 | $50,923 | $144,632 |
| 2019 | $3,186 | $191,722 | $49,925 | $141,797 |
| 2018 | $3,116 | $187,964 | $48,947 | $139,017 |
| 2017 | $3,023 | $184,280 | $47,988 | $136,292 |
| 2016 | $2,732 | $180,668 | $47,048 | $133,620 |
| 2015 | $2,773 | $177,955 | $46,342 | $131,613 |
| 2014 | $2,707 | $174,470 | $45,435 | $129,035 |
Source: Public Records
Map
Nearby Homes
- 2019 Oak St
- 2020 Aspen St
- 2222 Barbara St
- 3239 Lee St
- 2221 Floral Ave
- 2850 Mccall Ave Unit A-F
- 1607 Cooper St
- 2232 Gaither St
- 12623 S Mccall Ave
- 2841 C St
- 2002 Merced St
- 2629 Mccall Ave
- 2980 Olive St
- 1340 Lewis St
- 1405 Huntsman Ave
- 2226 Arrants St
- 2753 Thompson Ave
- 1517 Stillman St
- 2510 Whitson St
- 3654 Thompson Ave
Your Personal Tour Guide
Ask me questions while you tour the home.