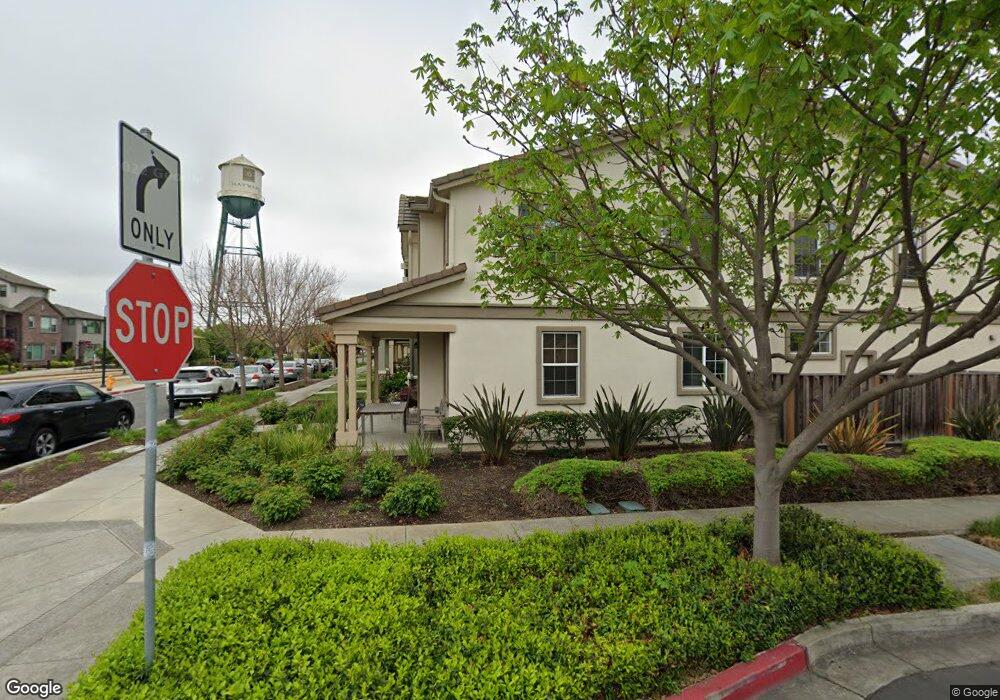
2103 Parkhurst St Unit 446 Hayward, CA 94541
Burbank NeighborhoodEstimated Value: $966,000 - $1,135,000
4
Beds
3
Baths
1,888
Sq Ft
$567/Sq Ft
Est. Value
About This Home
This home is located at 2103 Parkhurst St Unit 446, Hayward, CA 94541 and is currently estimated at $1,070,775, approximately $567 per square foot. 2103 Parkhurst St Unit 446 is a home located in Alameda County with nearby schools including Burbank Elementary School, Winton Middle School, and Hayward High School.
Ownership History
Date
Name
Owned For
Owner Type
Purchase Details
Closed on
May 4, 2019
Sold by
Tsang Cheuk Yu and Zhao Yihan
Bought by
Tsang Cheuk Yu and Zhao Yihan
Current Estimated Value
Purchase Details
Closed on
May 11, 2012
Sold by
Tsang Cheuk Yu and Zhao Yihan
Bought by
Tsang Cheuk Yu and Zhao Yihan
Home Financials for this Owner
Home Financials are based on the most recent Mortgage that was taken out on this home.
Original Mortgage
$353,000
Outstanding Balance
$244,002
Interest Rate
3.85%
Mortgage Type
New Conventional
Estimated Equity
$826,773
Purchase Details
Closed on
Oct 26, 2010
Sold by
Kb Home South Bay Inc
Bought by
Tsang Cheuk Y and Zhao Yihan
Home Financials for this Owner
Home Financials are based on the most recent Mortgage that was taken out on this home.
Original Mortgage
$359,461
Interest Rate
4.17%
Mortgage Type
New Conventional
Create a Home Valuation Report for This Property
The Home Valuation Report is an in-depth analysis detailing your home's value as well as a comparison with similar homes in the area
Home Values in the Area
Average Home Value in this Area
Purchase History
| Date | Buyer | Sale Price | Title Company |
|---|---|---|---|
| Tsang Cheuk Yu | -- | None Available | |
| Tsang Cheuk Yu | -- | Chicago Title Company | |
| Tsang Cheuk Y | $449,500 | First American Title Company |
Source: Public Records
Mortgage History
| Date | Status | Borrower | Loan Amount |
|---|---|---|---|
| Open | Tsang Cheuk Yu | $353,000 | |
| Closed | Tsang Cheuk Y | $359,461 |
Source: Public Records
Tax History Compared to Growth
Tax History
| Year | Tax Paid | Tax Assessment Tax Assessment Total Assessment is a certain percentage of the fair market value that is determined by local assessors to be the total taxable value of land and additions on the property. | Land | Improvement |
|---|---|---|---|---|
| 2025 | $8,044 | $575,598 | $172,564 | $403,034 |
| 2024 | $8,044 | $564,315 | $169,181 | $395,134 |
| 2023 | $7,916 | $553,254 | $165,865 | $387,389 |
| 2022 | $7,760 | $542,407 | $162,613 | $379,794 |
| 2021 | $7,694 | $531,772 | $159,425 | $372,347 |
| 2020 | $7,619 | $526,322 | $157,791 | $368,531 |
| 2019 | $7,640 | $516,006 | $154,698 | $361,308 |
| 2018 | $7,224 | $505,893 | $151,666 | $354,227 |
| 2017 | $7,078 | $495,976 | $148,693 | $347,283 |
| 2016 | $6,728 | $486,254 | $145,779 | $340,475 |
| 2015 | $6,611 | $478,953 | $143,590 | $335,363 |
| 2014 | $6,112 | $469,571 | $140,777 | $328,794 |
Source: Public Records
Map
Nearby Homes
- 414 Palmer Ave
- 273 Sullivan Way
- 2050 Jubilee Dr
- 252 Sullivan Way
- 626 Moss Way
- 622 Moss Way
- 610 Staley Ave
- 589 Staley Ave
- 1042 Old Oak Ln
- 1110 Red Wing Dr
- 2315 Gibbons St
- 200 Old Oak Ln Unit 3
- 22939 Santa Clara St
- 22592 Sonoma St
- 266 Smalley Ave
- 350 Smalley Ave
- 406 Craven Ct
- 439 Holly Ln
- 333 Winton Ave
- 462 Craven Ct
- 2101 Parkhurst St Unit 447
- 2105 Parkhurst St Unit 445
- 353 Williams Way
- 22763 Filbert St
- 2107 Parkhurst St
- 2109 Parkhurst St Unit 443
- 2111 Parkhurst St
- 2113 Parkhurst St Unit 441
- 327 Williams Way
- 315 Williams Way
- 406 Palmer Ave
- 2110 Jubilee Dr
- 326 Williams Way
- 2057 Parkhurst St Unit 451
- 2059 Parkhurst St Unit 450
- 2061 Parkhurst St
- 2063 Parkhurst St Unit 448
- 329 Williams Way
- 323 Williams Way
- 412 Palmer Ave