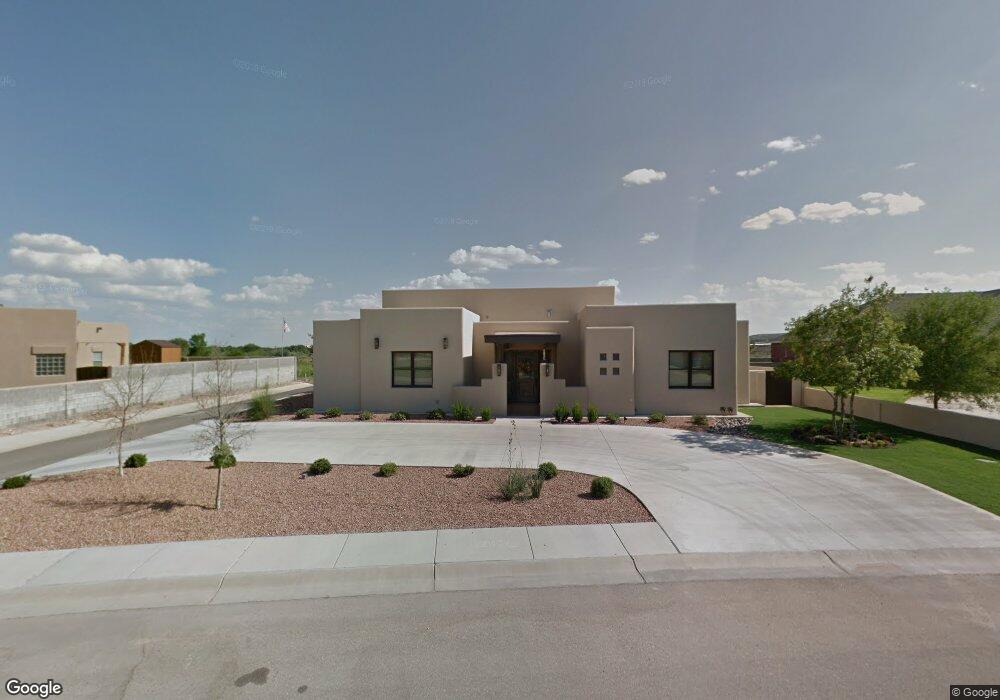
2103 Quail Hollow Run Carlsbad, NM 88220
Estimated Value: $533,023 - $774,000
--
Bed
--
Bath
4,724
Sq Ft
$133/Sq Ft
Est. Value
About This Home
This home is located at 2103 Quail Hollow Run, Carlsbad, NM 88220 and is currently estimated at $628,506, approximately $133 per square foot. 2103 Quail Hollow Run is a home with nearby schools including Ocotillo Elementary School, Carlsbad Intermediate School - PR Leyva Campus, and Carlsbad High School.
Ownership History
Date
Name
Owned For
Owner Type
Purchase Details
Closed on
Feb 10, 2014
Sold by
Greer James E and Greer Marilyn P
Bought by
Greer James E
Current Estimated Value
Purchase Details
Closed on
Jan 4, 2012
Sold by
Williams Patricia D
Bought by
Greer James E and Greer Marilyn P
Purchase Details
Closed on
Aug 31, 2009
Sold by
Springs Farms Subdivision Inc
Bought by
Young Robert N and Young Cheri A
Home Financials for this Owner
Home Financials are based on the most recent Mortgage that was taken out on this home.
Original Mortgage
$35,392
Interest Rate
5.16%
Mortgage Type
Credit Line Revolving
Create a Home Valuation Report for This Property
The Home Valuation Report is an in-depth analysis detailing your home's value as well as a comparison with similar homes in the area
Home Values in the Area
Average Home Value in this Area
Purchase History
| Date | Buyer | Sale Price | Title Company |
|---|---|---|---|
| Greer James E | -- | Guaranty Title Company | |
| Greer James E | -- | Guaranty Title Co | |
| Young Robert N | -- | Guaranty Title Co |
Source: Public Records
Mortgage History
| Date | Status | Borrower | Loan Amount |
|---|---|---|---|
| Previous Owner | Young Robert N | $35,392 |
Source: Public Records
Tax History Compared to Growth
Tax History
| Year | Tax Paid | Tax Assessment Tax Assessment Total Assessment is a certain percentage of the fair market value that is determined by local assessors to be the total taxable value of land and additions on the property. | Land | Improvement |
|---|---|---|---|---|
| 2025 | $3,594 | $148,134 | $18,333 | $129,801 |
| 2024 | $3,635 | $148,134 | $18,333 | $129,801 |
| 2023 | $3,635 | $148,134 | $18,333 | $129,801 |
| 2022 | $3,607 | $148,134 | $18,333 | $129,801 |
| 2021 | $3,593 | $148,134 | $18,333 | $129,801 |
| 2020 | $77 | $148,134 | $18,333 | $129,801 |
| 2019 | $3,713 | $148,134 | $18,333 | $129,801 |
| 2018 | $3,696 | $148,134 | $18,333 | $129,801 |
| 2017 | $3,782 | $152,578 | $18,883 | $133,695 |
| 2015 | $3,946 | $0 | $0 | $0 |
| 2014 | $356 | $0 | $0 | $0 |
Source: Public Records
Map
Nearby Homes
- 1835 Lanette Dr
- 1840 Amber Dr
- 1905 Callaway Dr
- 2802 W Pierce St
- 2116 Westridge Rd
- 1614 Live Oak Place
- 1711 Live Oak Place
- 1502 Mountain Shadow Dr
- 2112 Westridge Rd
- 1510 S Country Club Cir
- 1403 S Country Club Cir
- 2403 Western Way
- 1611 Palo Verde Loop
- 2402 Legion St
- 1612 W Thomas St
- 1619 Redwood Loop
- 2200 W Pierce #4 St
- 1209 Cedar Dr
- 1100 Chitalpa Ct
- 3002 Ocotillo Canyon Dr
- 2105 Quail Hollow Run
- 2101 Quail Hollow Run
- 1901 Blue Quail Ct
- 1902 Blue Quail Ct
- 2108 Quail Hollow Run
- 2031 Quail Hollow Run
- 2029 Quail Hollow Run
- 1903 Blue Quail Ct
- 2109 Quail Hollow Run
- 1901 Gambel Quail Ct
- 2110 Quail Hollow Run
- 2110 Quail Hollow
- 1904 Blue Quail Ct
- 1905 Blue Quail Ct
- 2027 Quail Hollow Run
- 1902 Gambel Quail Ct
- 2111 Quail Hollow Run
- 1906 Blue Quail Ct
- 1903 Gambel Quail Ct
- 2112 Quail Hollow Run