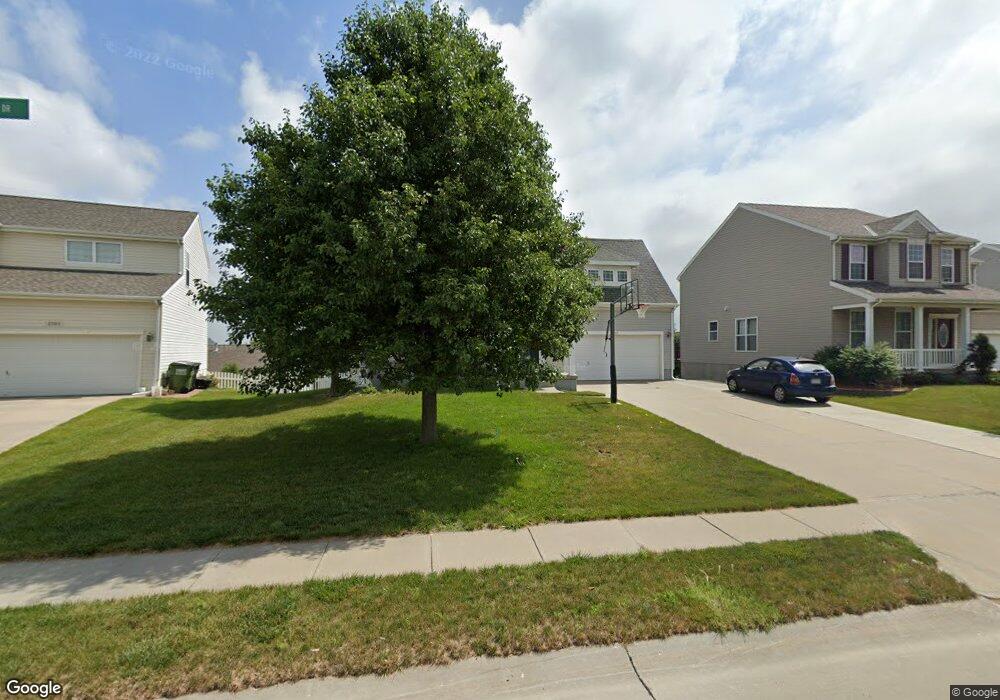
2103 S Mineral Dr Papillion, NE 68046
Estimated Value: $357,564 - $386,000
4
Beds
3
Baths
2,325
Sq Ft
$161/Sq Ft
Est. Value
About This Home
This home is located at 2103 S Mineral Dr, Papillion, NE 68046 and is currently estimated at $373,891, approximately $160 per square foot. 2103 S Mineral Dr is a home located in Sarpy County with nearby schools including Patriot Elementary School, Liberty Middle School, and Papillion La Vista South High School.
Ownership History
Date
Name
Owned For
Owner Type
Purchase Details
Closed on
Mar 10, 2005
Sold by
Hearthstone Homes Inc
Bought by
Pawloski Cory M and Pawloski Susan R
Current Estimated Value
Home Financials for this Owner
Home Financials are based on the most recent Mortgage that was taken out on this home.
Original Mortgage
$162,400
Outstanding Balance
$86,251
Interest Rate
5.75%
Estimated Equity
$287,640
Purchase Details
Closed on
Mar 9, 2005
Sold by
Boyer Young Equities Iv Llc
Bought by
Hearthstone Homes Inc
Home Financials for this Owner
Home Financials are based on the most recent Mortgage that was taken out on this home.
Original Mortgage
$162,400
Outstanding Balance
$86,251
Interest Rate
5.75%
Estimated Equity
$287,640
Create a Home Valuation Report for This Property
The Home Valuation Report is an in-depth analysis detailing your home's value as well as a comparison with similar homes in the area
Home Values in the Area
Average Home Value in this Area
Purchase History
| Date | Buyer | Sale Price | Title Company |
|---|---|---|---|
| Pawloski Cory M | $192,000 | -- | |
| Hearthstone Homes Inc | $232,000 | -- |
Source: Public Records
Mortgage History
| Date | Status | Borrower | Loan Amount |
|---|---|---|---|
| Open | Pawloski Cory M | $162,400 |
Source: Public Records
Tax History Compared to Growth
Tax History
| Year | Tax Paid | Tax Assessment Tax Assessment Total Assessment is a certain percentage of the fair market value that is determined by local assessors to be the total taxable value of land and additions on the property. | Land | Improvement |
|---|---|---|---|---|
| 2025 | $5,319 | $314,409 | $54,000 | $260,409 |
| 2024 | $5,875 | $307,070 | $50,000 | $257,070 |
| 2023 | $5,875 | $281,182 | $47,000 | $234,182 |
| 2022 | $5,720 | $250,982 | $42,000 | $208,982 |
| 2021 | $5,376 | $229,865 | $39,000 | $190,865 |
| 2020 | $5,171 | $221,408 | $36,000 | $185,408 |
| 2019 | $4,959 | $214,615 | $34,000 | $180,615 |
| 2018 | $4,861 | $207,844 | $32,000 | $175,844 |
| 2017 | $4,702 | $201,294 | $32,000 | $169,294 |
| 2016 | $4,543 | $192,640 | $25,000 | $167,640 |
| 2015 | $4,542 | $186,516 | $25,000 | $161,516 |
| 2014 | $4,408 | $180,429 | $25,000 | $155,429 |
| 2012 | -- | $176,858 | $25,000 | $151,858 |
Source: Public Records
Map
Nearby Homes
- 2110 S Mineral Dr
- 2208 S Mineral Dr
- 2010 Ridgeview Dr
- 2105 Petersen Dr
- 813 Clearwater Dr
- 501 Kent Dr
- 2006 Diane St
- 514 Windsor Dr
- 309 Concord Cir
- 8904 Legacy St
- 8810 Legacy St
- 2221 Placid Lake Dr
- 1702 Kelsey St
- 8716 Legacy St
- 8811 Legacy St
- Lot 115 Ave Unit Lot 115
- 8717 Legacy St Unit Lot 71
- 1806 Walnut Creek Dr
- 8713 Legacy St Unit Lot 70
- 8709 Legacy St Unit Lot 69
- 2105 S Mineral Dr
- 2101 S Mineral Dr
- 2006 S River Rock Dr
- 2008 S River Rock Dr
- 2107 S Mineral Dr
- 2004 S River Rock Dr
- 804 Mineral Dr
- 2102 S River Rock Dr
- 2102 S Mineral Dr
- 2106 S Mineral Dr
- 2109 S Mineral Dr
- 2002 S River Rock Dr
- 803 Mineral Dr
- 2104 S River Rock Dr
- 806 Mineral Dr
- 805 Port Royal Dr
- 807 Port Royal Dr
- 2111 S Mineral Dr
- 808 Mineral Dr
- 2106 S River Rock Dr