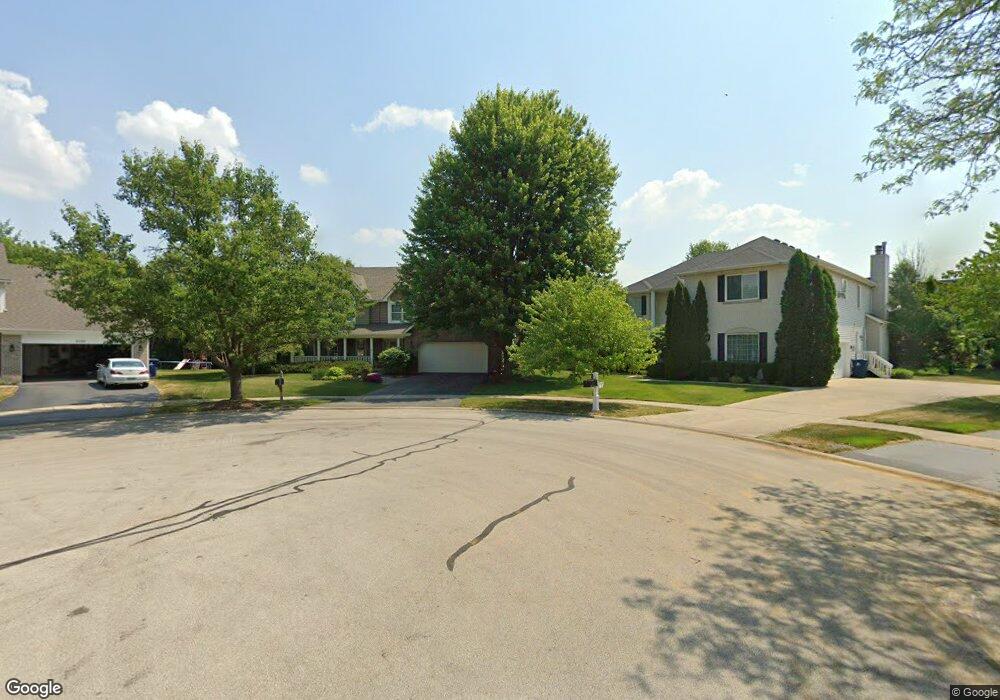
2103 Sand Island Ct Naperville, IL 60564
Saddle Creek NeighborhoodEstimated Value: $646,000 - $698,181
--
Bed
1
Bath
2,758
Sq Ft
$244/Sq Ft
Est. Value
About This Home
This home is located at 2103 Sand Island Ct, Naperville, IL 60564 and is currently estimated at $672,795, approximately $243 per square foot. 2103 Sand Island Ct is a home located in Will County with nearby schools including Oliver Julian Kendall Elementary School, Ellsworth Elementary School, and Clifford Crone Middle School.
Ownership History
Date
Name
Owned For
Owner Type
Purchase Details
Closed on
Oct 17, 2024
Sold by
Corbin Dennis and Drozd Catherine E
Bought by
Drocor-Ced Living Trust and Drozd
Current Estimated Value
Purchase Details
Closed on
Apr 21, 2015
Sold by
Corbin Dennis and Drozd Catherine
Bought by
Drocor Dwc Living Trust
Purchase Details
Closed on
Jan 15, 1996
Sold by
Merchants National Bank Of Aurora
Bought by
Corbin Dennis and Drozd Catherine
Home Financials for this Owner
Home Financials are based on the most recent Mortgage that was taken out on this home.
Original Mortgage
$203,000
Interest Rate
7.19%
Purchase Details
Closed on
Nov 15, 1995
Sold by
Firstar Bank Illinois
Bought by
Merchants National Bank Of Aurora
Home Financials for this Owner
Home Financials are based on the most recent Mortgage that was taken out on this home.
Original Mortgage
$204,000
Interest Rate
8.75%
Create a Home Valuation Report for This Property
The Home Valuation Report is an in-depth analysis detailing your home's value as well as a comparison with similar homes in the area
Home Values in the Area
Average Home Value in this Area
Purchase History
| Date | Buyer | Sale Price | Title Company |
|---|---|---|---|
| Drocor-Ced Living Trust | -- | None Listed On Document | |
| Drocor Dwc Living Trust | -- | None Available | |
| Corbin Dennis | $255,000 | Chicago Title Insurance Co | |
| Merchants National Bank Of Aurora | $64,000 | Chicago Title Insurance Co |
Source: Public Records
Mortgage History
| Date | Status | Borrower | Loan Amount |
|---|---|---|---|
| Previous Owner | Corbin Dennis | $203,000 | |
| Previous Owner | Merchants National Bank Of Aurora | $204,000 |
Source: Public Records
Tax History Compared to Growth
Tax History
| Year | Tax Paid | Tax Assessment Tax Assessment Total Assessment is a certain percentage of the fair market value that is determined by local assessors to be the total taxable value of land and additions on the property. | Land | Improvement |
|---|---|---|---|---|
| 2024 | $11,944 | $198,358 | $44,186 | $154,172 |
| 2023 | $11,944 | $175,228 | $39,034 | $136,194 |
| 2022 | $10,312 | $153,330 | $36,925 | $116,405 |
| 2021 | $9,836 | $146,029 | $35,167 | $110,862 |
| 2020 | $9,642 | $143,715 | $34,610 | $109,105 |
| 2019 | $9,464 | $139,665 | $33,635 | $106,030 |
| 2018 | $9,268 | $134,723 | $32,895 | $101,828 |
| 2017 | $10,102 | $139,265 | $32,046 | $107,219 |
| 2016 | $10,082 | $136,267 | $31,356 | $104,911 |
| 2015 | $9,577 | $131,026 | $30,150 | $100,876 |
| 2014 | $9,577 | $122,425 | $30,150 | $92,275 |
| 2013 | $9,577 | $122,425 | $30,150 | $92,275 |
Source: Public Records
Map
Nearby Homes
- 1736 Robert Ln
- 2255 Wendt Cir
- 1804 Princess Cir
- 2711 Wait Rd
- 29W316 Andermann Dr
- 2339 Ryegrass Ln Unit 64005
- 620 Switchgrass Way Unit 61006
- 2335 Ryegrass Ln Unit 64004
- 620 Redtop Way
- 2419 Lawlor Ln
- 668 Switchgrass Way Unit 58004
- 2423 Lawlor Ln
- 2519 Mallet Ct
- 2427 Lawlor Ln
- 688 Switchgrass Way Unit 57003
- 2539 Mallet Ct
- 2543 Mallet Ct
- 1112 Saratoga Ct
- 2547 Mallet Ct
- 5912 Hawkweed Dr Unit 7501
- 2107 Sand Island Ct
- 2104 Sand Island Ct
- 10920 Book Rd
- 2111 Sand Island Ct
- 4807 Daggets Ct
- 4803 Daggets Ct
- 2108 Sand Island Ct
- 2115 Sand Island Ct
- 4811 Daggets Ct
- 2112 Sand Island Ct
- 4804 Daggets Ct
- 4804 Daggets Ct Unit 4804
- 2116 Sand Island Ct
- 2119 Sand Island Ct
- 4740 Clearwater Ln
- 2019 Engle Rd
- 2120 Sand Island Ct Unit 1
- 2023 Engle Rd Unit 1
- 2015 Engle Rd
- 4808 Daggets Ct