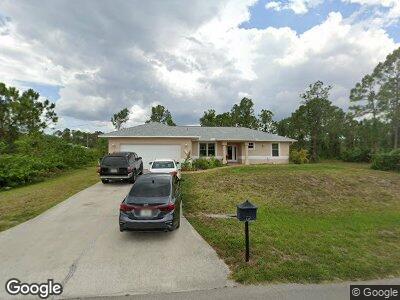
2103 W 9th St Lehigh Acres, FL 33972
Richmond NeighborhoodEstimated Value: $267,000 - $378,000
3
Beds
2
Baths
1,497
Sq Ft
$210/Sq Ft
Est. Value
About This Home
This home is located at 2103 W 9th St, Lehigh Acres, FL 33972 and is currently estimated at $314,270, approximately $209 per square foot. 2103 W 9th St is a home located in Lee County with nearby schools including Lehigh Elementary School, Gateway Elementary School, and The Alva School.
Ownership History
Date
Name
Owned For
Owner Type
Purchase Details
Closed on
Mar 12, 2020
Sold by
Jean Jean Altema Altema
Bought by
Souverain Louis E
Current Estimated Value
Purchase Details
Closed on
Jul 13, 2010
Sold by
Secretary Department Of Housing & Urban
Bought by
Jean Jean Altema Altema
Purchase Details
Closed on
Mar 2, 2010
Sold by
Zambrana Alberto Martinez
Bought by
Countrywide Home Loans Servicing Lp
Purchase Details
Closed on
Jul 9, 2008
Sold by
L Plus Land Developers/Builders Llc
Bought by
Zambrana Alberto Martinez
Home Financials for this Owner
Home Financials are based on the most recent Mortgage that was taken out on this home.
Original Mortgage
$211,678
Interest Rate
6.27%
Mortgage Type
FHA
Purchase Details
Closed on
Jun 15, 2006
Sold by
Rawlins Anselm E
Bought by
L Plus Land Developers Builders Llc
Purchase Details
Closed on
Sep 23, 2005
Sold by
Siev Inc
Bought by
Rawlins Andelm E
Create a Home Valuation Report for This Property
The Home Valuation Report is an in-depth analysis detailing your home's value as well as a comparison with similar homes in the area
Home Values in the Area
Average Home Value in this Area
Purchase History
| Date | Buyer | Sale Price | Title Company |
|---|---|---|---|
| Souverain Louis E | -- | None Available | |
| Jean Jean Altema Altema | $47,500 | Lawyers Advantage Title Grou | |
| Countrywide Home Loans Servicing Lp | -- | Attorney | |
| Zambrana Alberto Martinez | $215,000 | Surety Title Corporation | |
| L Plus Land Developers Builders Llc | $23,500 | Community Title Group | |
| Rawlins Andelm E | $2,900 | Tradewinds Title Inc |
Source: Public Records
Mortgage History
| Date | Status | Borrower | Loan Amount |
|---|---|---|---|
| Previous Owner | Zambrana Alberto Martinez | $211,678 |
Source: Public Records
Tax History Compared to Growth
Tax History
| Year | Tax Paid | Tax Assessment Tax Assessment Total Assessment is a certain percentage of the fair market value that is determined by local assessors to be the total taxable value of land and additions on the property. | Land | Improvement |
|---|---|---|---|---|
| 2024 | $2,152 | $160,665 | -- | -- |
| 2023 | $2,152 | $155,985 | $0 | $0 |
| 2022 | $2,027 | $151,442 | $0 | $0 |
| 2021 | $1,952 | $147,031 | $4,225 | $142,806 |
| 2020 | $2,233 | $138,083 | $4,000 | $134,083 |
| 2019 | $2,179 | $131,630 | $4,000 | $127,630 |
| 2018 | $2,042 | $119,499 | $3,800 | $115,699 |
| 2017 | $1,957 | $115,463 | $3,045 | $112,418 |
| 2016 | $1,785 | $98,167 | $3,045 | $95,122 |
| 2015 | $1,627 | $83,197 | $2,710 | $80,487 |
| 2014 | $1,446 | $75,597 | $2,075 | $73,522 |
| 2013 | -- | $64,904 | $2,000 | $62,904 |
Source: Public Records
Map
Nearby Homes
- 2101 W 9th St
- 911 Dixie Ave
- 2005 W 10th St
- 2519 20th St SW
- 919 Dixie Ave Unit 22
- 2603 22nd St W
- 1006 Pine Ave
- 1900 W 10th St Unit 13
- 917 Oak Ave
- 1008 Pine Ave
- 8000 Fountain Mist Blvd
- 2609 19th St W
- 2610 20th St W
- 2505 15th St W
- 2561 25th St W
- 2604 23rd St W Unit 13
- 814 Rush Ave
- 2606 24th St W
- 2515 26th St W Unit 3
- 2619 18th St W Unit 1